TDM Report Generator
Introduction
The TDM Overview Report Generator is a critical tool for optimising the management and analysis of test data in software development. It automatically generates detailed PDF reports using the Ecosystem and TDM APIs to provide a comprehensive view of the test data lifecycle. This tool is essential for database administrators, data engineers, and software testers, offering insights into each stage of test data management, including profiling, masking, and validation, with pre-scan details and forensic scan metrics included in the appendix.
Key functionalities include:
- Executive Summary: Summarises overall compliance, key PII and data-source metrics, risk factor distribution, and a per data source execution timeline.
- Profiling: Analyses profiling duration, configuration, and sensitive data identification.
- Masking: Summarises data masking activities and outcomes for data security.
- Validation: Reports on the final validation of the test data management process.
- Appendix:
- Pre-Scan: Lists each Ecosystem data connection used for the report, including type, identifiers, name, and any masking/validation data-range cut-offs.
- Forensic Scan: Details database size, user count, and schema specifics. A detailed explanation on the key functionalities of the report are further discussed below in the Structure section.
Purpose
The purpose of this report generator is multifaceted:
-
Detailed Analysis: It provides in-depth insights across the Executive Summary, Profiling, Masking, and Validation sections, along with additional pre-scan details and forensic scan metrics in the Appendix.
-
Enhanced Decision-Making: By offering detailed data on database type, size, user count, and schema specifics, it facilitates informed decision-making and efficient management strategies.
-
Data Security and Compliance: The tool emphasises data security through its masking and validation reports, ensuring compliance with data privacy standards.
-
Operational Efficiency: The generator's ability to quickly produce comprehensive reports aids in timely issue identification and resolution, thereby enhancing operational efficiency and data integrity.
This tool is not just a reporting mechanism, but a comprehensive solution that supports the continuous improvement and integrity of test data management, pivotal in today's data-driven software development landscape.
Structure
The Test Data Management Report is meticulously organised to provide a thorough understanding of the test data lifecycle. Each section is crafted to offer both detailed information and clarity.
Executive Summary
This section provides a consolidated overview of outcomes across all data sources included in the report.
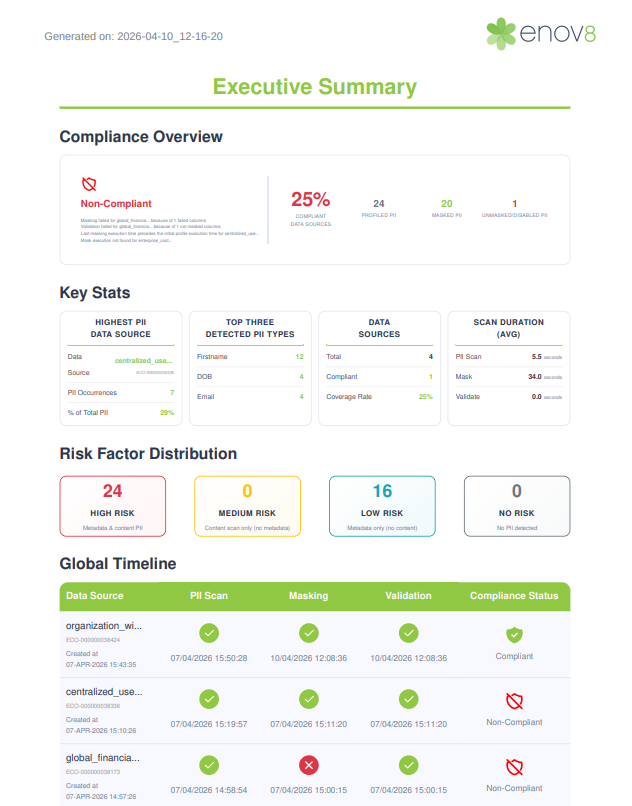

Compliance Overview
Shows the compliance status, non-compliance reasons when applicable, the compliance score, and counts of profiled, masked, and unmasked or disabled PII.
How each data source is labelled Compliant or Non-Compliant:
-
Profile: every profiling run (full and delta scans) included in the report must have a Passed status. If any run does not pass, that data source is non-compliant. If no profiling results are found for a data source, it is also marked non-compliant.
-
Mask: after merging all mask executions for that data source, the final column-level outcomes must show no column with a Failed result. Columns marked Disabled alone do not fail this rule. If no masking results are found for a data source, that data source is also marked non-compliant.
-
Validation: after combining all explicit and inline validation executions for that data source, no column may still show Not Masked in the merged column-level view.
-
Execution timeline: after the per-stage checks above, the report validates that all three stages are present and ran in the expected lifecycle order (Profile → Mask → Validate). A data source is marked non-compliant if any of the following are true:
- A Profile, Mask, or Validate execution is missing from the timeline.
- The last masking execution predates the initial profiling (full scan) execution.
- The last validation execution predates the initial profiling (full scan) execution.
- The initial validation execution predates the initial masking execution.
- The final validation execution is more recent than the final masking execution.
Once a data source is Non-Compliant, later steps in the report do not change it back to Compliant.
Key Stats
Highlights the data source with the most PII and its share of the total, the three most common PII categories, total and compliant data sources with coverage rate, and average profiling, masking, and validation durations where available.
Risk Factor Distribution
Counts columns by risk tier across all profiled data sources, based on how each column was classified in the metadata scan and content scan:
- High Risk: PII was found in both the metadata scan and the content scan.
- Medium Risk: PII was found in the content scan only.
- Low Risk: PII was flagged in the metadata scan only.
- No Risk: No PII detected for that column.
Global Timeline
A table per data source with connection creation time, the execution status and timestamp of the latest profile, mask, and validation runs, and a separate compliance column. The PII scan, masking, and validation columns reflect execution status of each stage. They do not by themselves mean the data source is compliant; the compliance column carries that overall label.
The Compliance status column can still show Non-Compliant even when PII scan, masking, and validation each show Passed. Execution success for those stages does not guarantee overall compliance — the execution timeline checks and column-level results described in the Compliance Overview section also apply. Specific reasons are listed in the Compliance Overview card at the top of the report.
A PII scan, masking, or validation cell can show Pending even when an execution exists for that stage. This happens when runs do not follow the native lifecycle order (Profile → Mask → Validate), as described under Execution timeline in Compliance Overview. In those cases the report overrides the displayed status and timestamp for the affected stage(s) — typically Masking and/or Validation — so Pending reflects that the stage is out of sequence, not that no execution was found.
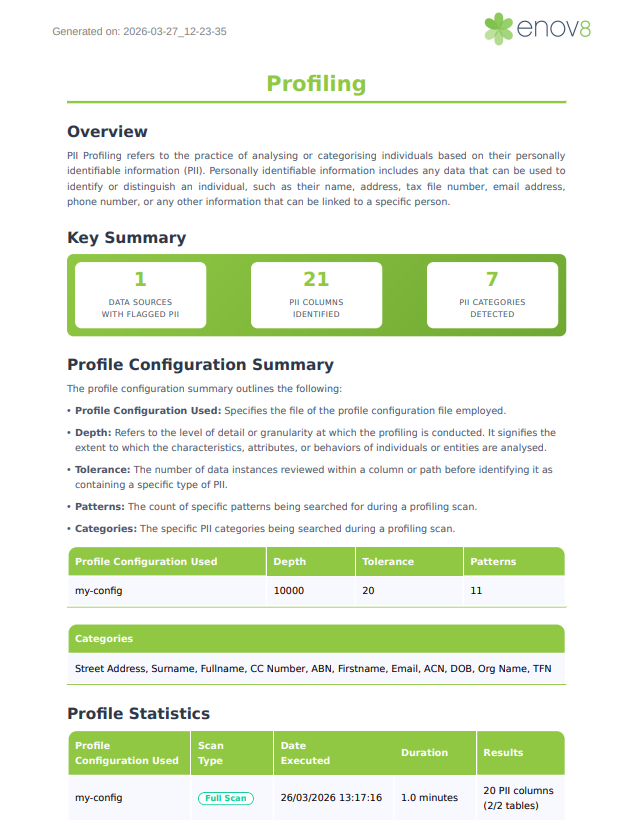
Profiling
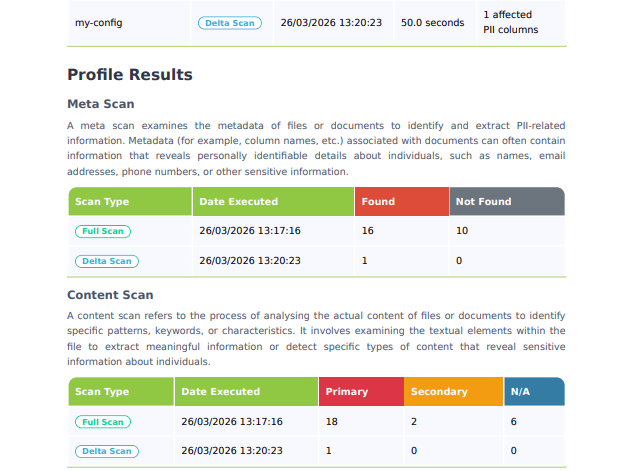
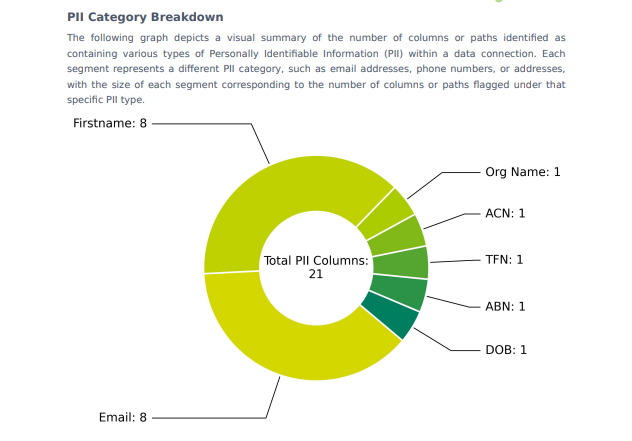
The Profiling section includes a brief overview of PII profiling and a key summary of data sources with flagged PII, identified PIIs, and categories detected. It then presents tables summarising the active profile configuration (depth, tolerance, patterns, and searched categories), showing data connections when the report is grouped. Per-run profile statistics give scan type, date, duration, and a concise results summary, and the profile results add meta scan and content scan counts. When any PII categories were detected, a chart shows the PII category breakdown.
For each data connection, TDM begins with the most recent full scan, then includes every delta scan for that same connection that started after the full scan timestamp. The profiling report combines this full scan with all qualifying delta scans and processes them as a single set for that connection. If no delta scans qualify, the report includes only the full scan.
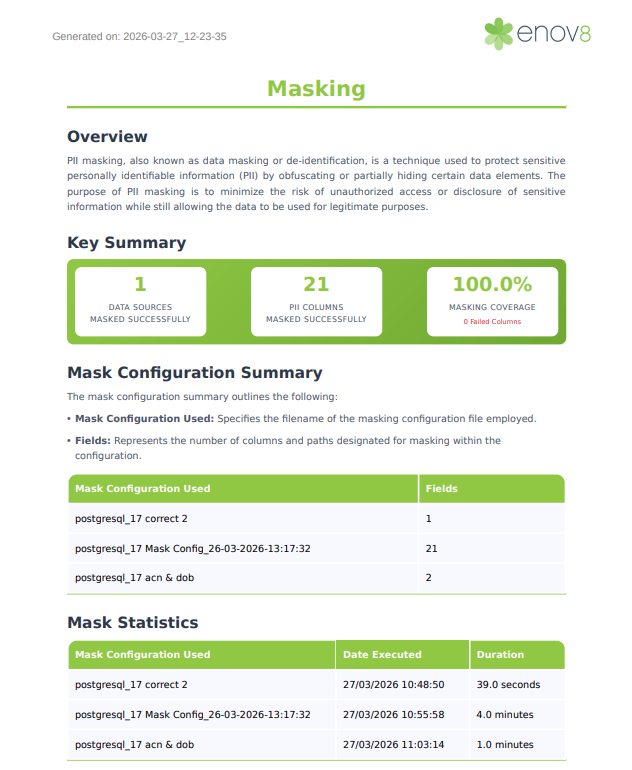
Masking
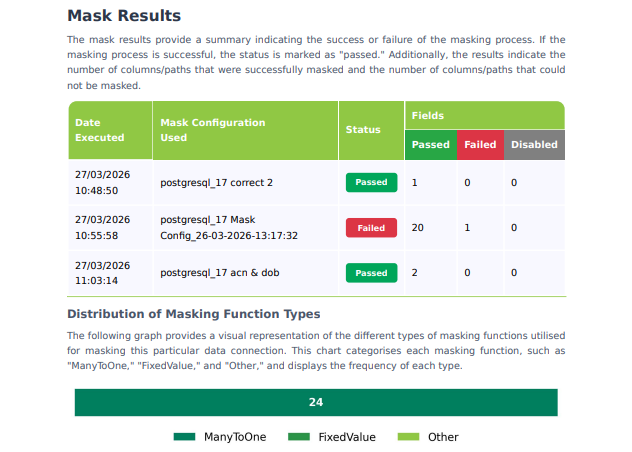
The Masking section includes a key summary of data sources and PII columns masked successfully, masking coverage, and any columns that failed. It then lists each mask configuration in use and how many fields each covers, showing data connections when the report is grouped. Per-run mask statistics give the date and duration of each execution, and the mask results add overall status with counts of fields passed, failed, and disabled. When masking functions were applied, a chart shows how those function types are distributed across the run.
To determine each column's final masking status when a data connection has several executions, TDM walks those runs in order. Whenever a run returns Passed, Failed, or Disabled for that field, that value replaces any earlier outcome for the same field. If a later run does not include a column in its results, that column's status is unchanged, so the effective status is always the outcome from the most recent run that reported that column.
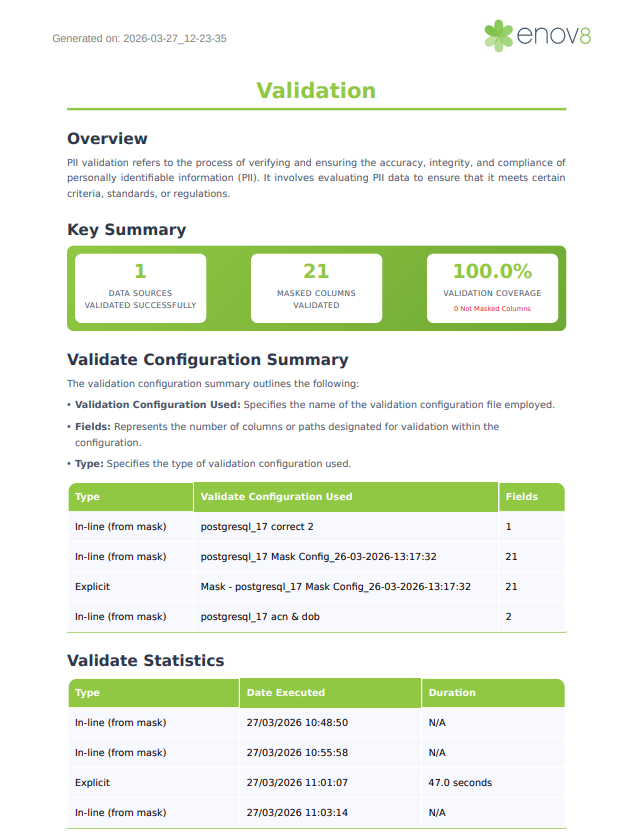
Validation
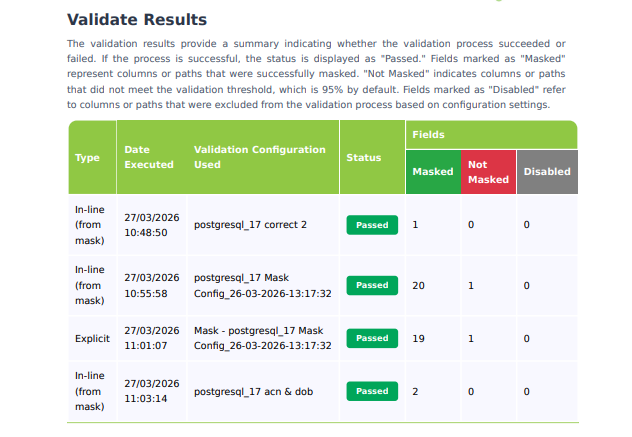
The Validation section includes a key summary of data sources validated successfully, how many columns were validated as masked, validation coverage, and how many columns are not masked. It also includes a configuration table with validation type, the validate configuration in use, and field counts. Per-run validate statistics show type, date executed, and duration, and validate results show overall status plus masked, not masked, and disabled field counts.
To determine each column's final validation status when there are several validation-related executions, TDM merges in-line and explicit runs in timestamp order. For each column, whenever a run reports Masked, Not Masked, or Disabled, that value replaces any earlier result for the same column; if a later run omits the column, the previous status remains. The outcome is then checked against masking: if there is no validation for a column, or the latest validation for that column is older than the latest masking run, the column is treated as Not Masked.
Appendix
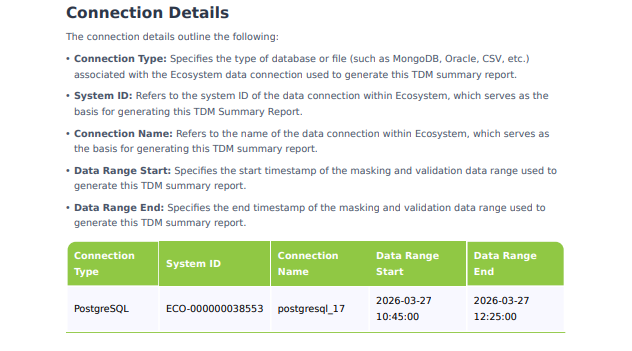
Pre-Scan
This section lists each Ecosystem data connection the summary is built from: connection type, system ID, connection name, and data range start and data range end, which correspond to the date range the user selects in the Ecosystem UI and bound the masking and validation executions included in the report.
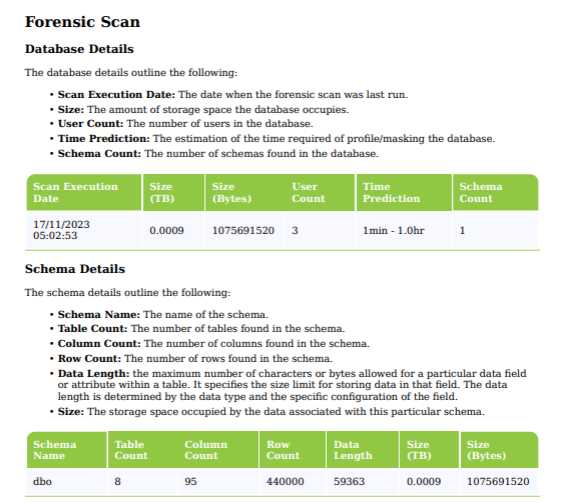
Forensic Scan
This section contains two tables. Database Details shows the scan execution date, database size, user count, and schema count for each data connection. Schema Details breaks down each schema with its name, total and null table counts, column count, row count, and size.
Usage
Generating Single TDM Report
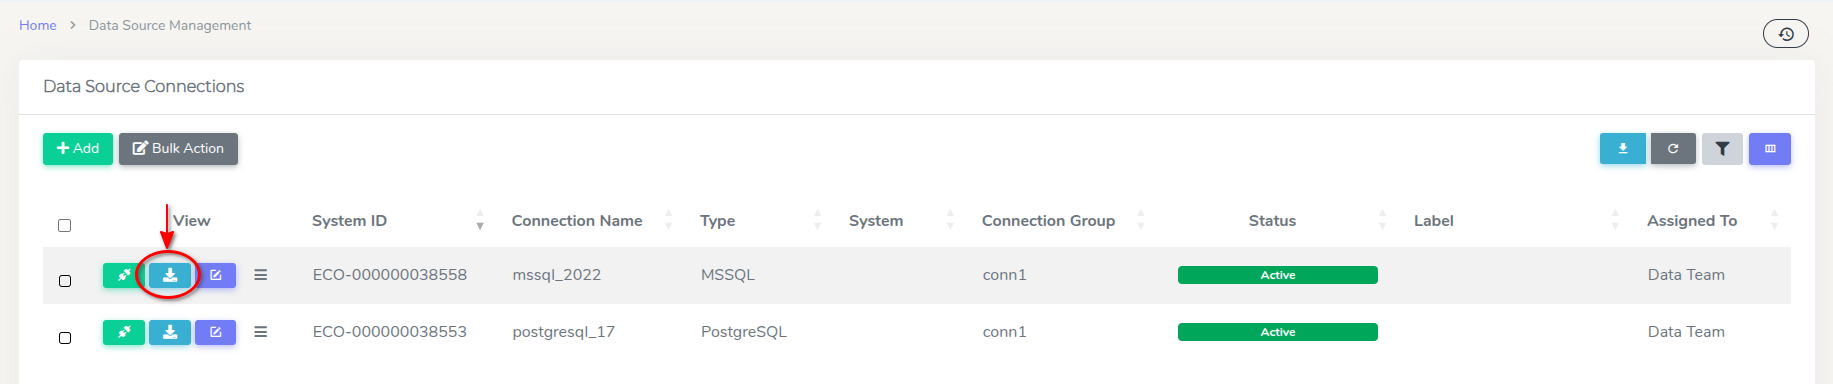
Firstly, navigate to Data > Administration > Data Source Management. Then select a data source, and click on the download report button.
A popup window will then appear, allowing you to select the date range and choose whether to include scan results in CSV format.
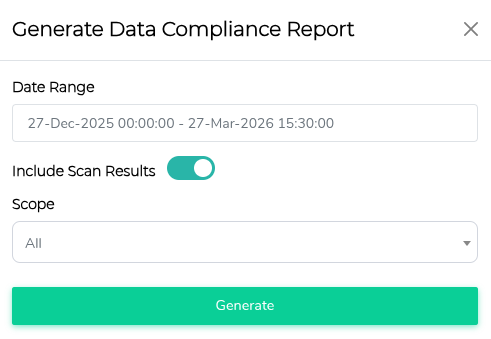
- Date range: Sets the start and end date and time used as the execution window for the report. Masking and validation data are restricted to runs that fall within this window.
- Include scan results: Turns on generation of CSV files for scan outputs (profiling, masking, and validation) in addition to the PDF. Leave it off if you only want the overview PDF.
- Scope (shown when Include scan results is on): Controls how rows are filtered in the profiling CSV only. Masking and validation CSVs are not narrowed by this setting.
- All: Every column from the profile scan export is included.
- PII & metadata columns only: Keeps columns that have a content-level PII finding or a non-clear meta scan result.
- PII columns only: Keeps columns that have a content-level PII finding.
tipWhen All is not selected, you can also restrict by PII category; if you leave categories empty, all categories are included by default.
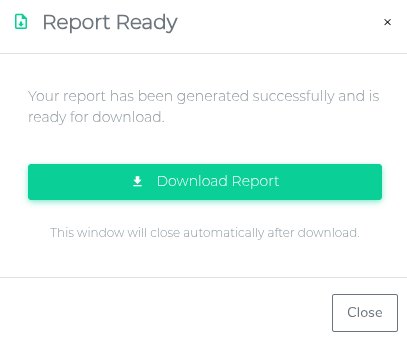
After selecting the desired options, press Generate. This should start the report generation process. Once the report compilation is complete, it will be ready for download.
Generating Bulk TDM Reports
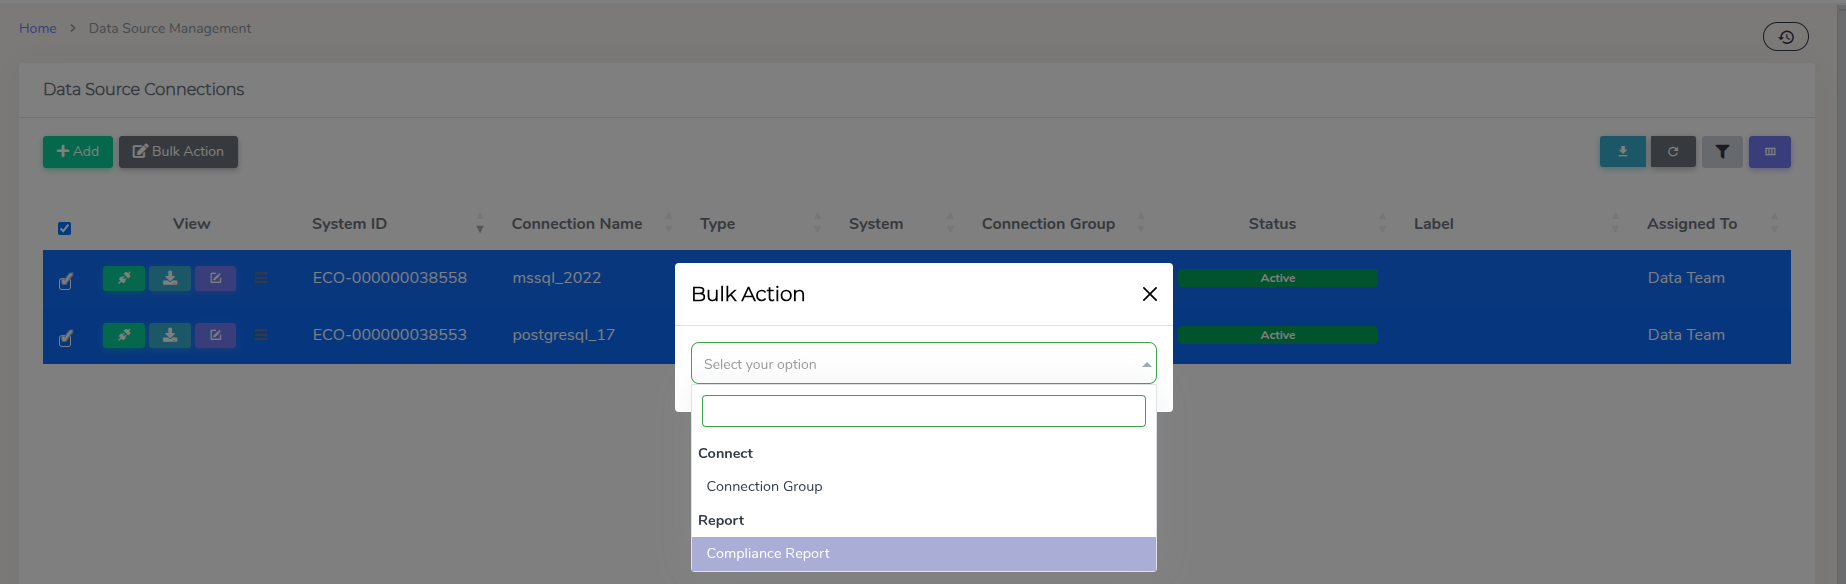
Navigate to Data > Administration > Data Source Management. Then select multiple the data sources you want to include in the report, and click on the Bulk Action button.
Then, select Compliance Report on the popup window for the first field.
A selection window will then appear, where you can choose the date range and whether to include scan results in CSV format. For a detailed explanation of each option, see Generating Single TDM Report.
After selecting the desired options, press Generate. This should start the report generation process. Once the report compilation is complete, it will be ready for download.