Custom Dashboards
Overview
The Custom Dashboard feature allows the administrator to create new dashboards. The dashboards can use various design using the templates available and choose data bricks / widgets to be displayed in the selected design templates.
Adding/Editing Dashboards
Custom Dashboard can be created and managed by Custom Dashboard module which can assessed by System Administration section.
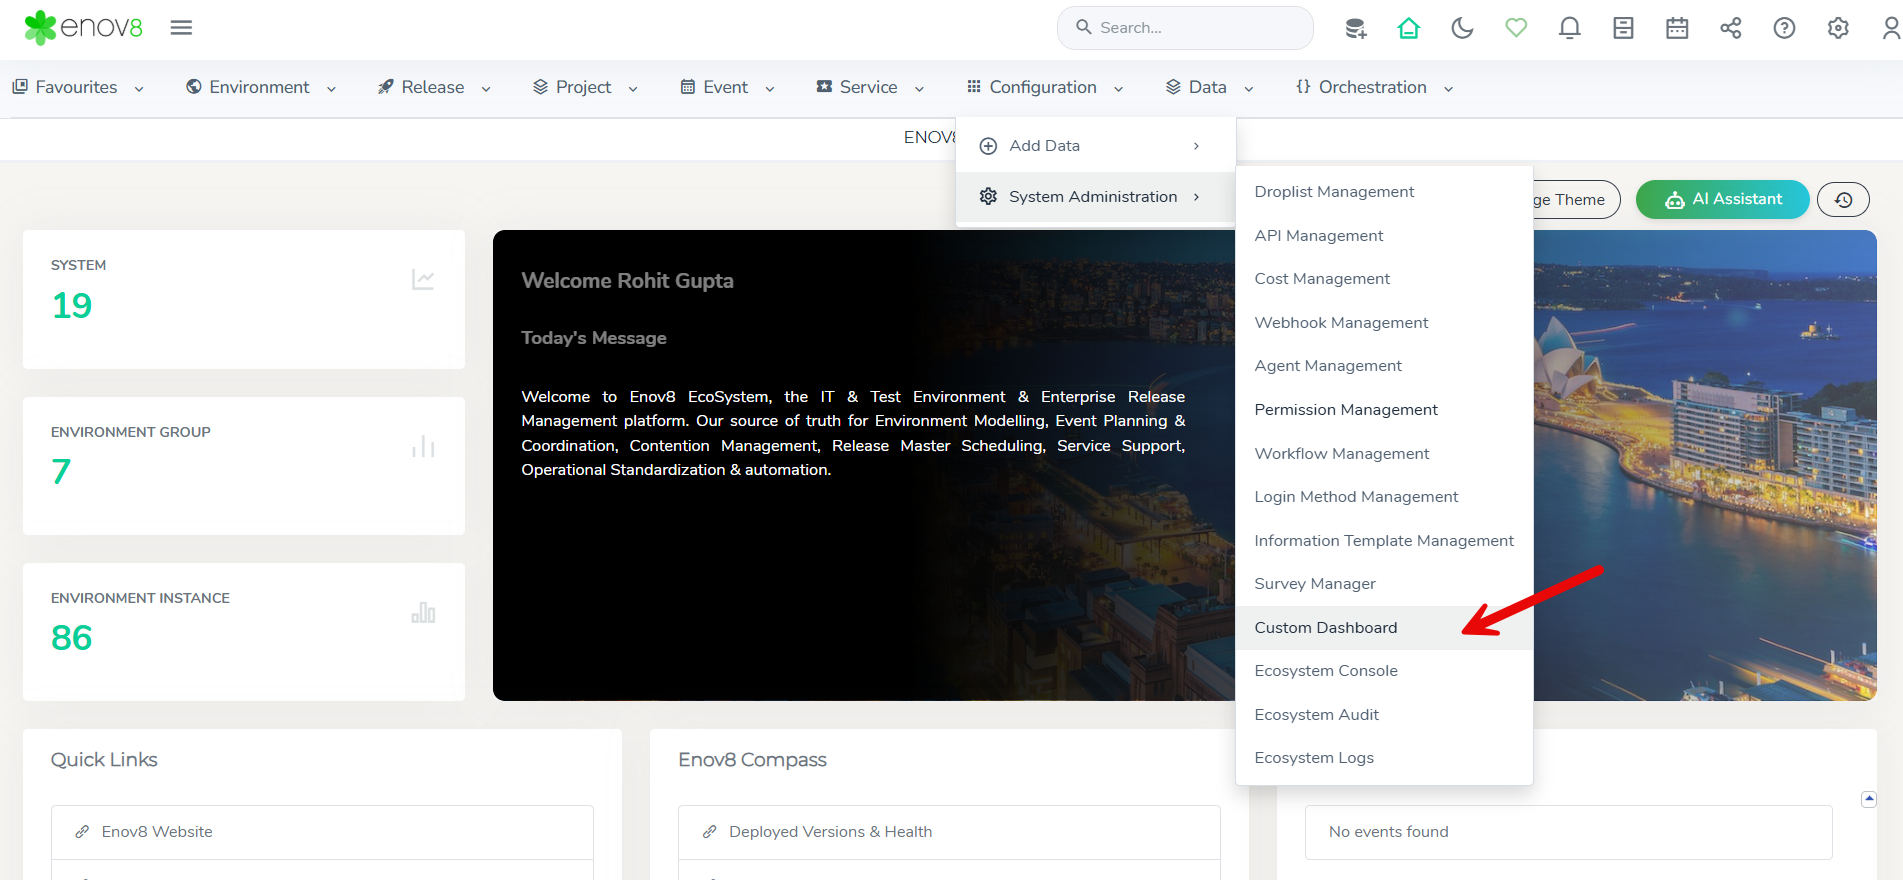
Navigate to Configuration > System Administration > Custom Dashboards
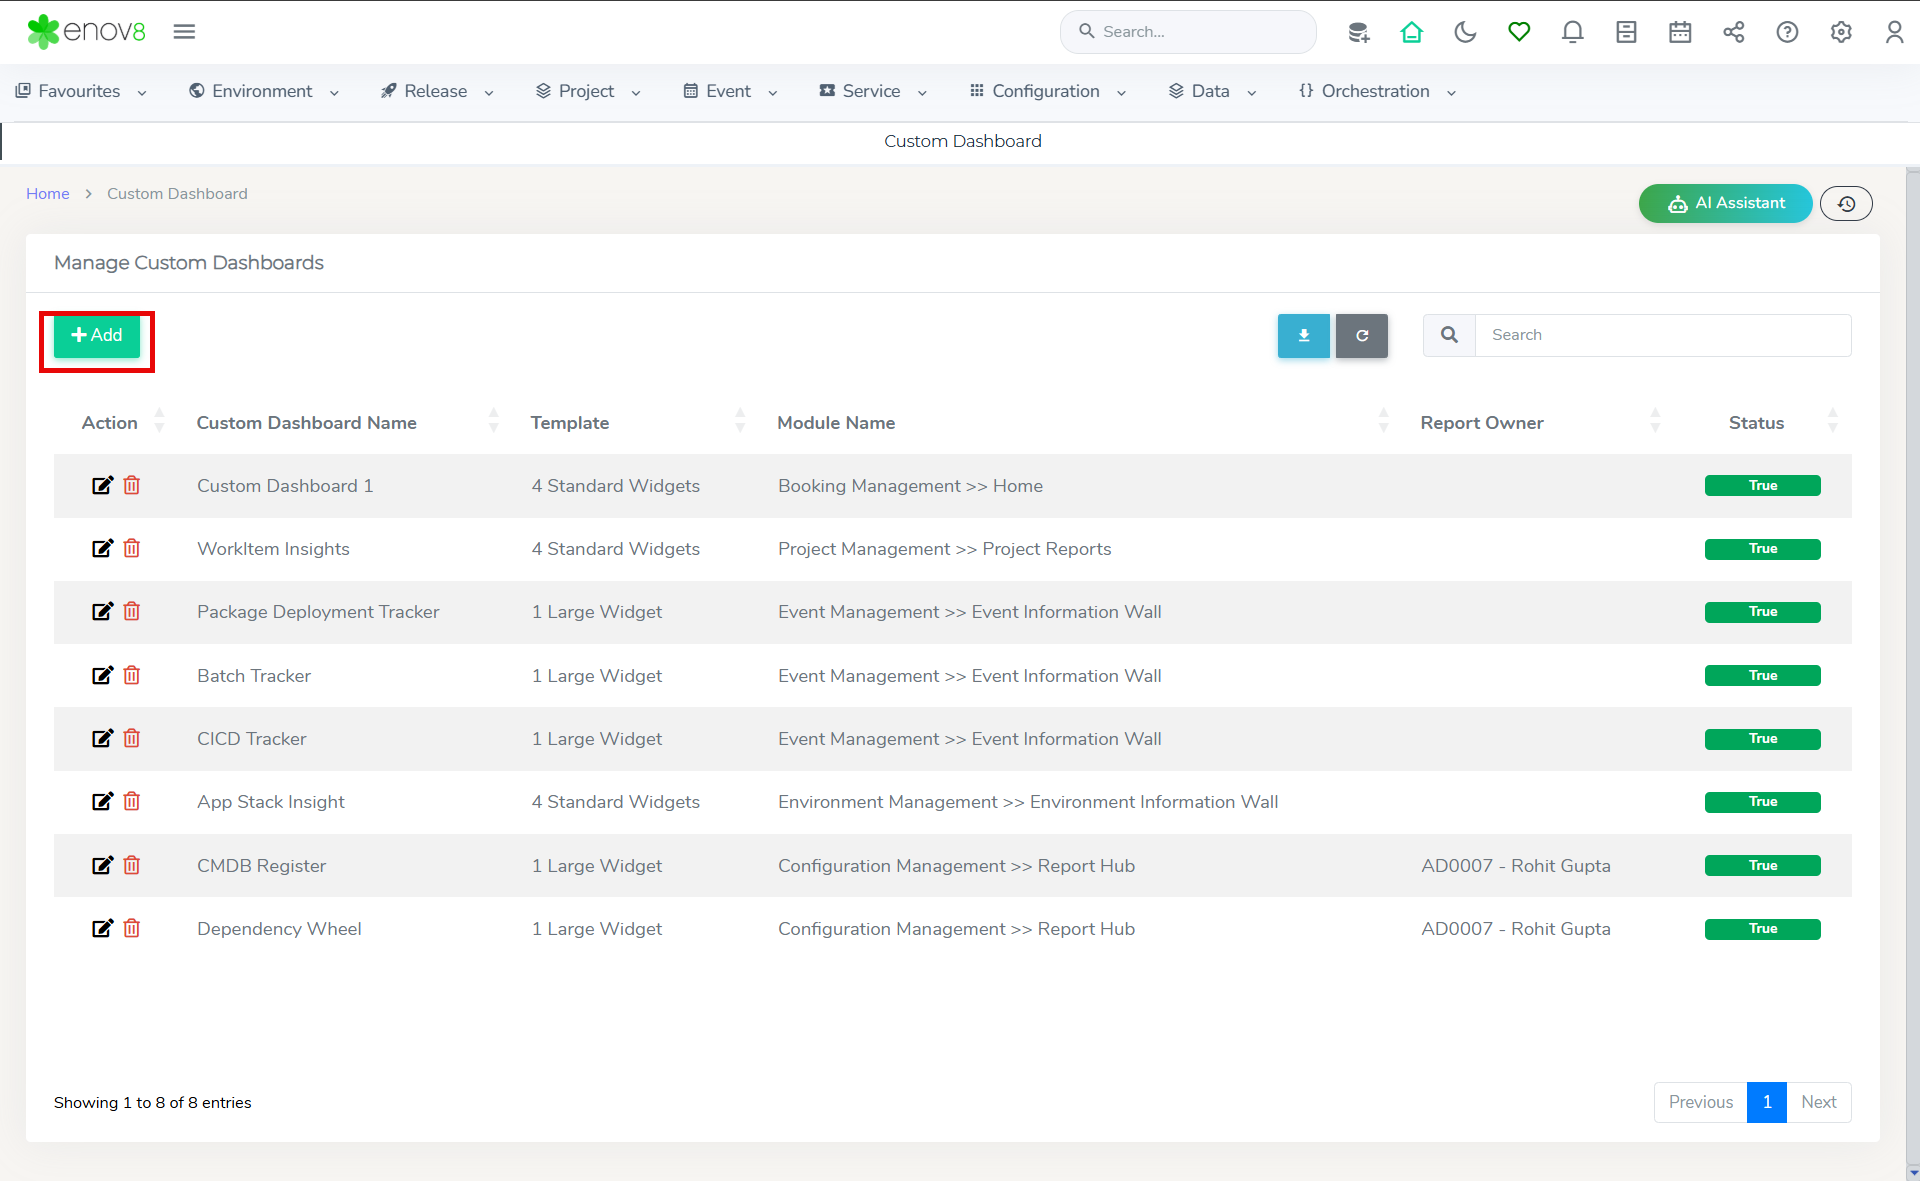
To add a new custom dashboard, click on “Ädd” button and to edit click on the edit button in front of specific dashboard.
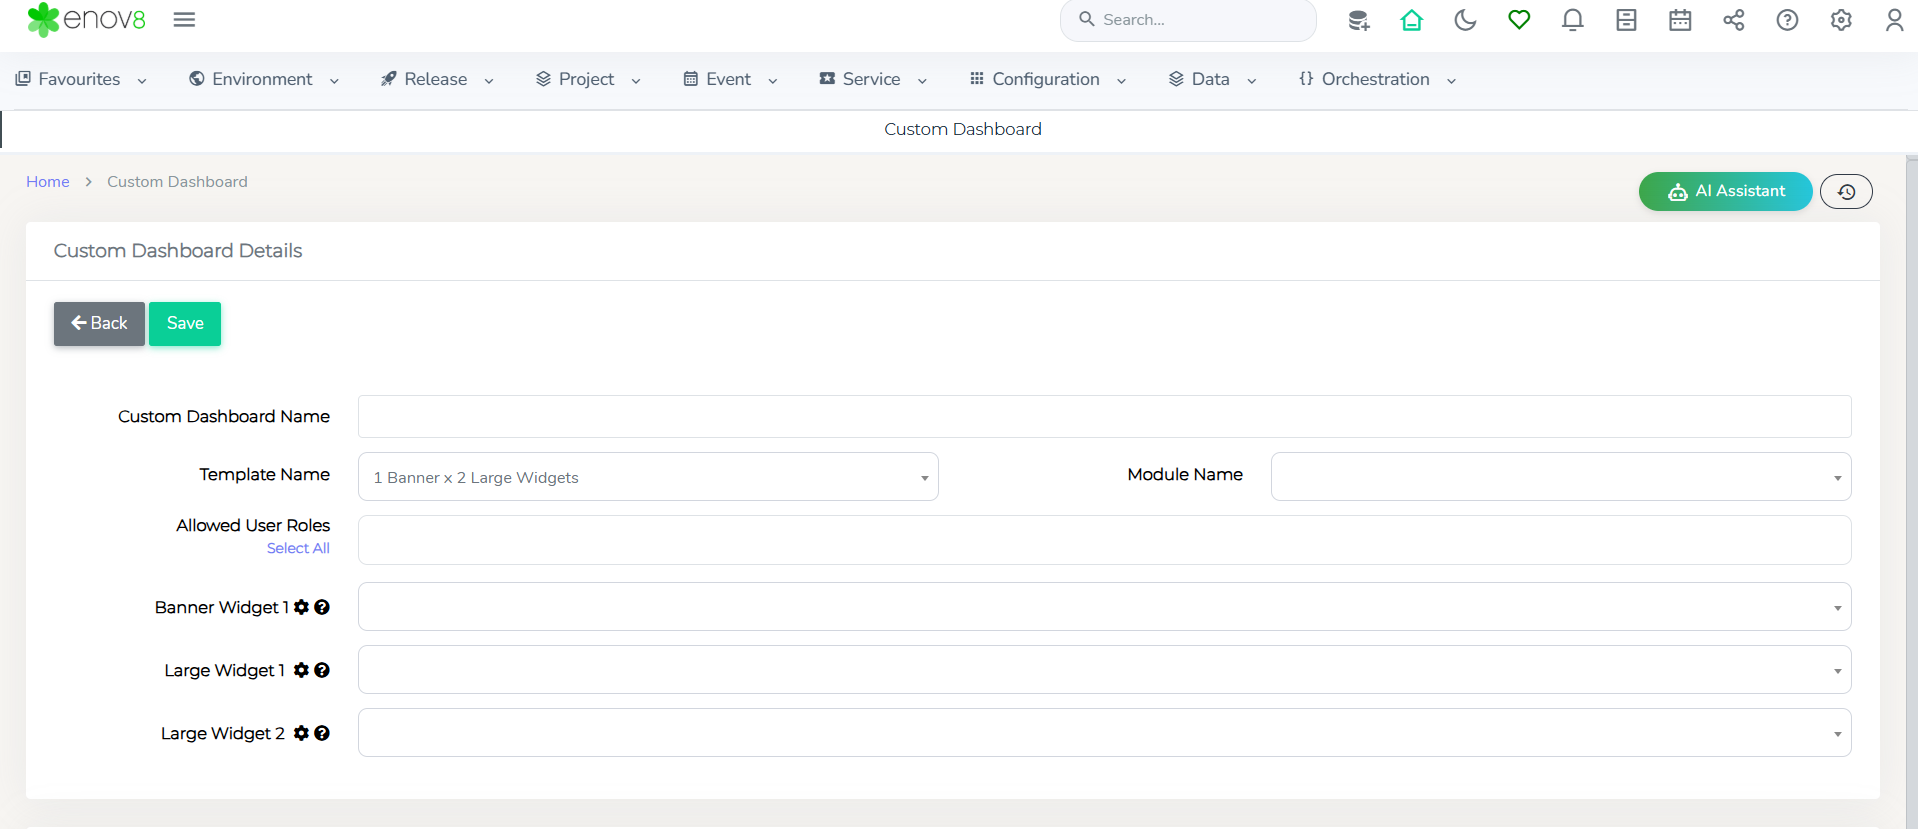
On Click Add or Edit a new form will be available which has the following inputs
• Custom Dashboard Name: Name of the custom dashboard.
• Template: Style of Template to be used for the custom dashboard.
• Allowed User Roles: User Roles which can access this custom dashboard.
• Module Name: Name of the ecosystem module where this custom dashboard will be visible. The custom dashboard will be automatically added to Home section of this selected module.
• Widgets – The widgets that would be visible on the dashboard. The number of widgets depend on the template selected.
Widget Configuration option can be used to change the available configuration of the widget and title of the widget. To modify the configuration, click on the clog icon in from of the required widget dropdown.
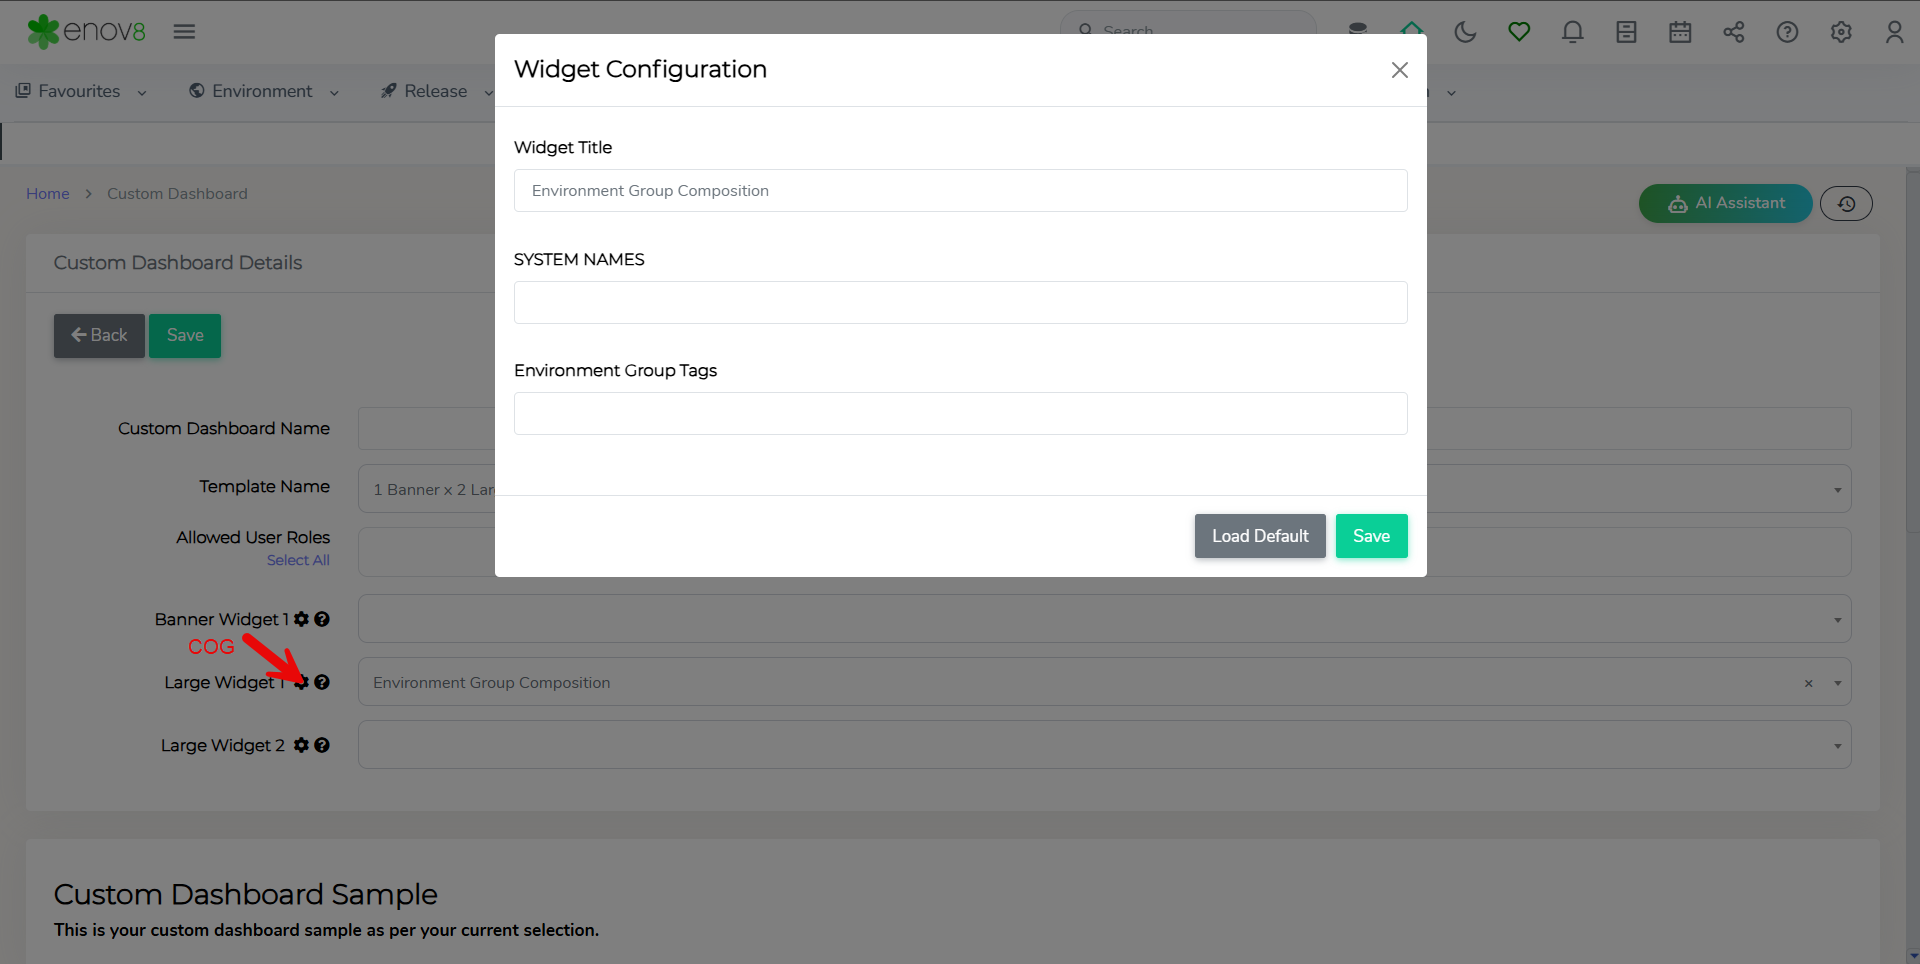
In case you would need to revert to original configuration, simply click on Load Default button.
Custom Widgets
Booking
| Title | Description |
|---|---|
| Current Booking Demand By Project (Top 10) | This widget allows the user to view the demand of system instances from active bookings by project. |
| Current Booking Demand By System Instance (Top 10) | This widget allows the user to view the demand of system instances from active bookings by system instance. |
| Booking Request Trend (Last 6 Months) | This widget allows you to view the trend of booking requests received per month. |
| Active Booking Status | This widget allows the user to view the summary of active bookings status. |
| Active Confirmed Booking Total | This widget allows you to view the total of all active confirmed bookings. |
| Active Unconfirmed Booking Total | This widget allows you to view the total of all active unconfirmed bookings. |
| Booking Requests (Last 12 Months) Total | This widget allows you to view the total of booking requests received per month. |
| Active Booking Total | This widget allows the user to view the total of active bookings. |
| System Instance Booking Usage Summary | This widget allows the user to view the overall system instance booking usage in a particular time period. |
| Booking Status Summary | This widget allows the user to view the summary of status of bookings in a particular time period. |
| User Booking Request Activity | This widget allows you to view summary of number of booking requests raised by users. |
| System Instance Usage | This widget allows you to view usage of system instances based on bookings for a particular system. |
| Environment Booking Demand Forecast | This widget allows you to view and compare current active booking total with bookings in next 3 months for each environment in a bar graph. |
| Current Active Environment Bookings | This widget allows you to view current active environment bookings in a gantt style view. |
| Environment Usage | This widget allows you to view the environment usage within a selected timeframe. |
CMDB
| Title | Description |
|---|---|
| Unavailable System Components | This widget allows the user to view unavailable system components. |
| Unavailable System Instances | This widget allows the user to view unavailable system instances. |
| System Instance Tags | This widget allows you to view tag information for the selected system instance. |
| System Instance Tag Matrix | This widget allows you to view tag information for the selected system instance. |
| Active Environment Total | This widget allows you to view the total of all active environments. |
| Active System Total | This widget allows you to view the total of all active systems. |
| Active System Instance Total | This widget allows you to view the total of all active system instances. |
| Active System Component Total | This widget allows you to view the total of all active components. |
| CMDB Overview | This widget allows you to view summary for CMDB. |
| System Instance Status Overview | This widget allows you to view a chart view of System Instance status. |
| System Instance Status Overview by Business Unit | This widget allows you to view a chart view of System Instance status. |
| System Instance Composition | This widget provided a overview composition of systems instances by type. |
| System Environment Composition | This widget provides a report of System instances those are associated with the environment and system. |
| Dependency Wheel | This widget provides a graphical representation of dependencies. |
| Environment Composition | This widget provides a report of System instances those are associated with the environment and system based on the configuration. |
| System Composition | This widget provides a report of current version, label, and microservices those are associated with the environment and system based on the configuration. |
| Tag Composition | This widget provides a report of current tags those are associated with each system. |
| Components By Environment Name | This widget provides detail of system components for selected environment. |
| Deployed Package | This widget provides detail of deployed package in the environment. |
| System Summary By Business Unit | This widget provides an overview of system instance total by business unit and system. |
EnvEvent
| Title | Description |
|---|---|
| Environment Event Trend | This widget allows user to view the number of environment events in an environment. |
| Upcoming Planned Events | This widget allows you to view upcoming planned environment events. |
| Active Event Summary By Status | This widget allows you to view summary of active events by status. |
| Active Events Summary By Environment | This widget allows you to view summary of active events by environment. |
| Active Events Summary By System Instance | This widget allows you to view summary of active events by system instance. |
| Active Events Summary By Type | This widget allows you to view summary of active events by event type. |
| Current Active Event Calendar | This widget allows you to view current active events in a calendar style view. |
| EnvEvent Summary By Business Unit & Type | This widget provides an overview of env events total by business unit and env event type during the selected timeframe. |
| EnvEvent Summary By Business Unit & Assigned To Team | This widget provides an overview of env events total by business unit and assigned to during the selected timeframe. |
| Average Event Cycle Time Trend | This widget allows you to view trend of closed Event along with average cycle time to process the event. |
| Unplanned Outage Events By System with Passed and Closed Status | This widget shows the unplanned outage hours by each system. |
Data Compliance
| Title | Description |
|---|---|
| Data Source PII Splatter Heatmap | This widget provided an overview of PII presence in data sources. |
| Data Source Audit Status | This widget provided a summary of scan status for data sources in selected timeframe. |
| Data Source PII Heatmap By System | This widget provided a heatmap of PII in data sources by system. |
| Data Source Execution Trend | This widget provided a summary of executions within the selected timeframe along with average runtime. |
| Data Source PII Summary By System | This widget provided a summary of PII in data sources by system. |
| Data Source Scan Remediation Status Report | This widget provides a report of remediation status for data sources. |
| Executive Scan Summary | This widget provides a summary of executive scan summary. |
| Data Sources | This widget allows you to view the total number of data sources. |
Custom
Custom widgets allow users to create their own widgets with their own HTML code, datatable, column chart, bar chart, etc. These widgets allows user to specify their own data source class and defined conditions to display the data.
Using Property Name, Value, and Condition
When pulling information in custom widgets, you can use four key properties to filter data effectively:
- Property Name: The name of the attribute or field you want to query.
- Property Condition: The condition to apply to the respective attribute (e.g., equality, inequality, greater than, etc.).
- Property Value: The value(s) used for comparison with the specified property.
- Display Properties: The properties that will be returned by the API based on the conditions specified in the above three properties.
Each value in these properties is separated by a semicolon (;), and corresponding values across these properties align to form a filter condition.
Example Breakdown
Input Example:
- Property Name:
Resource Name;Status - Property Condition:
==;!= - Property Value:
GDW;Deleted
This setup represents the following filter conditions:
- Filter all data where Resource Name is equal to
GDW(==). - Exclude all data where Status is equal to
Deleted(!=).
Expected Output:
The API will return data where:
Resource NameisGDW, andStatusis notDeleted.
Key Points to Note:
- Semicolon Alignment: Ensure that the values in
Property Name,Property Condition, andProperty Valuealign correctly with their respective positions.- For example, the first value of
Property Namecorresponds to the first value ofProperty ConditionandProperty Value.
- For example, the first value of
- Conditions Supported: The API may support common conditions such as:
==: Equal to!=: Not equal to<,>: Less than, greater than<=,>=: Less than or equal to, greater than or equal to
- Using
+Operator in Values: If you need to query multiple values for a single property, you can use the+operator to combine them.
Example:Property Name:Resource NameProperty Condition:==Property Value:GDW+Salesforce- Result: Data where
Resource Nameis eitherGDWorSalesforce.
Common Scenarios
- Single Condition: To filter only by one property, specify a single set of values.
Example:
Property Name:StatusProperty Condition:!=Property Value:Inactive- Result: Data where
Statusis not equal toInactive.
- Multiple Values: Use the
+operator to filter by multiple values for a single property. Example:Property Name:Resource TypeProperty Condition:==Property Value:Server+Database- Result: Data where
Resource Typeis eitherServerorDatabase.
| Title | Description |
|---|---|
| Custom HTML Box | This widget allows you to create a widget with your own HTML code. |
| Custom Data Table | This widget allows you to create your own datatable from ecosystem class and defined conditions. |
| Custom Small Widget | This widget allows you to create your own small widget from ecosystem class and defined conditions. |
| Custom Data View | This widget allows you to view data from your custom data sql. |
| Custom Column Chart | This widget allows you to create your own column chart from ecosystem class and defined conditions. |
| Custom Bar Chart | This widget allows you to create your own bar chart from ecosystem class and defined conditions. |
| Iframe Third Party URL | This widget allows you to create your own iframe based on provided URL. |
| Custom Calendar | This widget allows you to create your own custom calendar. |
| Custom Column Chart With Grid View | This widget allows you to create your own column chart including grid view tab from ecosystem class and defined conditions. |
| Custom Bar Chart With Grid View | This widget allows you to create your own bar chart including grid view tab from ecosystem class and defined conditions. |
| Custom Data Table With Date Filter | This widget allows you to create your own data table based on selected timeline from ecosystem class and defined conditions. |
| Custom Fact Sheet Bar Chart | This widget allows you to create your own fact sheet bar chart from ecosystem class and defined conditions. |
| Custom Fact Sheet Bar Chart With Grid View | This widget allows you to create your own fact sheet bar chart including grid view tab from ecosystem class and defined conditions. |
Other
| Title | Description |
|---|---|
| URL Links | This widget allows you to create quick url links to any third party websites or applications. |
| Quick Links | This widget allows you to create quick URL links to any third-party websites or applications. |
| Metric Data Table View | This widget allows you to view data from metric table. |
| Ecosystem Class Object Trend | This widget allows you to view summary of number of objects in different classes. |
Project
| Title | Description |
|---|---|
| In-Scope Projects | This widget allows you to view list of active projects which are in in-scope status. |
| Project System Demand | This widget allows you to view the demand of systems by projects in the selected timeframe. |
LeanSR
| Title | Description |
|---|---|
| User Service Request Activity | This widget allows you to view summary of number of service requests raised by users. |
| Service Request Trend (Last 6 Months) | This widget allows you to view the trend of service requests received per month. |
| Active LeanSR Summary By Type | This widget allows you to view summary of active service requests by type. |
| Active LeanSR Summary By System Instance | This widget allows you to view summary of active service requests by system instance. |
| Active LeanSR Summary By Status | This widget allows you to view summary of active service requests by status. |
| LeanSR Summary By Business Unit & Type | This widget provided an overview of total number of LeanSR by type and status for a business unit in the selected timeframe. |
| LeanSR Trend By Type | This widget allows you to view count of LeanSR by type in the selected timeframe. |
| Average Lean |
SR Cycle Time Trend | This widget allows you to view trend of closed LeanSR along with average cycle time to process the request. |
Workitem
| Title | Description |
|---|---|
| Workitem Trend By Type | This widget allows you to view the percentage distribution trend of workitems per month by type. |
| Active Workitem Distribution | This widget allows you to view summary of open workitems. |
| Average Workitem Cycle Time Trend | This widget allows you to view trend of closed workitems. |
| Active Workitem Distribution By System (Top 20) | This widget allows you to view summary of open workitems by system. |
| Release Workitem Insight | This widget provides detail of all the workitems for the selected release. |
Third Party Applications
| Title | Description |
|---|---|
| JIRA Data Widget | This widget allows you to view the data from JIRA based on the configuration. |
| SERVICENOW Data Widget | This widget allows you to view the data from Sericenow based on the configuration. |
| JENKINS Project Data Widget | This widget allows you to view the data of each jenkins project based on the configuration. |
Data Mart
| Title | Description |
|---|---|
| CSV View | This widget allows you to view csv data in tabular format. |
| JSON Data Mart | This widget allows you to view json files in a folder. |
| Data Mart | This widget allows you to view json files in a folder. |
BBOT
| Title | Description |
|---|---|
| BBOT Status Count | This widget allows you to create your own small widget to display BBOT status count. |
| BBOT Listing | This widget allows you to view BBOT listing. |
VO
| Title | Description |
|---|---|
| Automation Brick | This widget allows you to create your own script dashboard based on selected script. |
Data Compliance
| Title | Description |
|---|---|
| Data Source PII Splatter Heatmap | This widget provided a overview of PII presence in data sources. |
| Data Source Audit Status | This widget provided a summary of scan status for data sources in selected timeframe. |
| Data Source PII Heatmap By System | This widget provided a heatmap of PII in data sources by system. |
| Data Source Execution Trend | This widget provided a summary of executions within the selected timeframe along with average runtime. |
| Data Source PII Summary By System | This widget provided a summary of PII in data sources by system. |
| Data Source Scan Remediation Status Report | This widget provides a report of remediation status for data sources. |
| Executive Scan Summary | This widget provides a summary of executive scan summary. |
| Data Sources | This widget allows you to view the total number of data sources. |
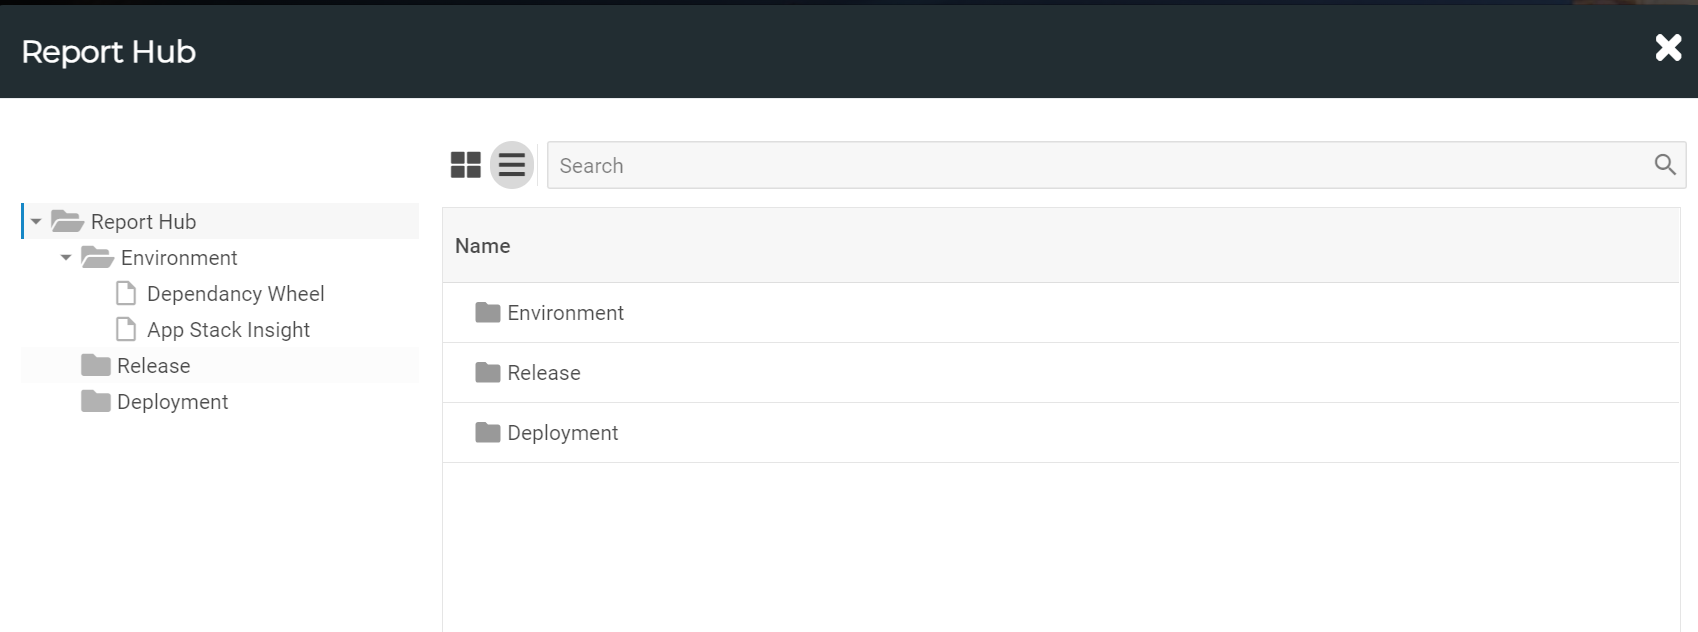
Report Hub
The Report Hub is a centralized location for accessing various reports. Users can view pre-built reports and dashboards, as well as add their own custom reports. Additionally, users have the option to create personal reports by marking them as Private, which restricts access to those reports from other users.
Report Hub
Adding Reports
To add a new custom report to the Report Hub, navigate to Configuration Management > System Administration > Custom Dashboards
To add a new custom dashboard, follow the steps as mentioned in the Adding/Editing Dashboards section.
Simply select the Report Hub in the Module Name field to add a new report to the Report Hub. On selection of Report Hub in the Module Name field, the following fields will be available:
| Title | Description |
|---|---|
| Category | Category in Left panel of Report Hub where the report will be displayed. New category can be added by using Report Hub Category option in droplist management section. |
| Private | True/False to make the report private. |