Environment Management
Fundamentals
Understanding your IT environments and effectively managing the associated knowledge is crucial for robust IT and Test Environment. To facilitate this, our platform includes a dedicated Visual Configuration Database (VCMDB).
The VCMDB defines several key Configuration Items (CIs):
-
Systems: These represent your suite of applications. It's important to note that Systems are conceptual parent items and do not count towards your licensing totals.
-
Environment Groups: Your organization might refer to these as Environment Lanes. Simply put, they are collections of Environment Instances configured to interact similarly to your production setup. Like Systems, Environment Groups are conceptual and do not impact licensing counts.
-
Environment Instances: These are the tangible application instances that cluster one or more Infrastructure Components, such as servers and databases. Environment Instances are the entities that projects reserve or book for development or testing tasks.
-
Infrastructure Components: These include the actual servers, databases, and other assets comprising your Environment Instances. They are typically linked to an Environment Instance for streamlined management, booking, and reporting.
For visual clarification, refer to the accompanying diagram (note that it excludes Environments for simplicity).
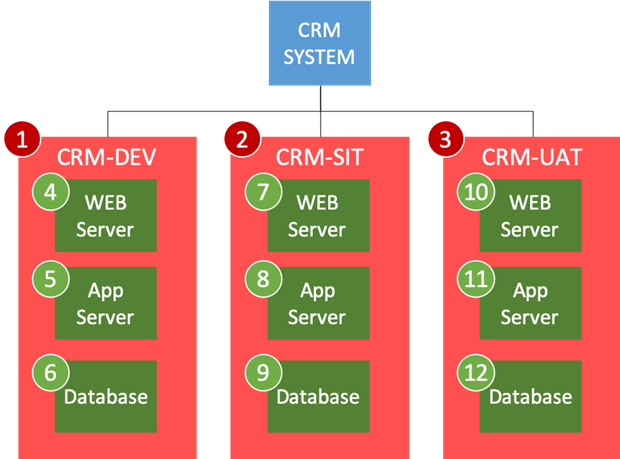
Organisations can choose to only model high-level information (1-3) as Environment Instances, or additionally can model the underlying servers as Infrastructure Components as well.
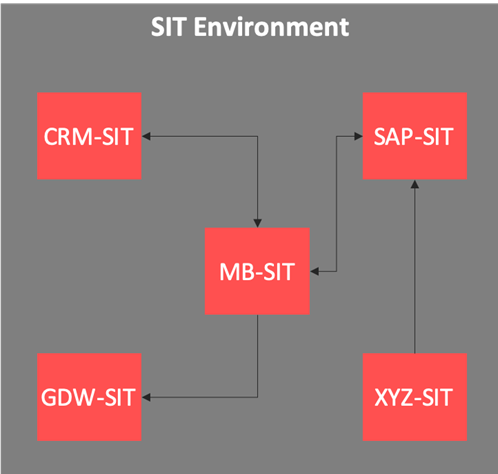
The below diagram explains how Environments come into the picture and enable the grouping of one or many Environment Instances as an “Environment” and how this can be depicted within the solution.
Modelling
In this section we’ll go through the foundations of adding & modifying the main Environment Configuration Items (CI). This can be done via the frontend, in bulk via a Comma Separated Values (CSV) file, or via the enov8 REST-API.
Please ensure you’ve reviewed and understood the previous section “Environment Modelling Fundamentals” as it explains the terminology and CI relationships for this section.
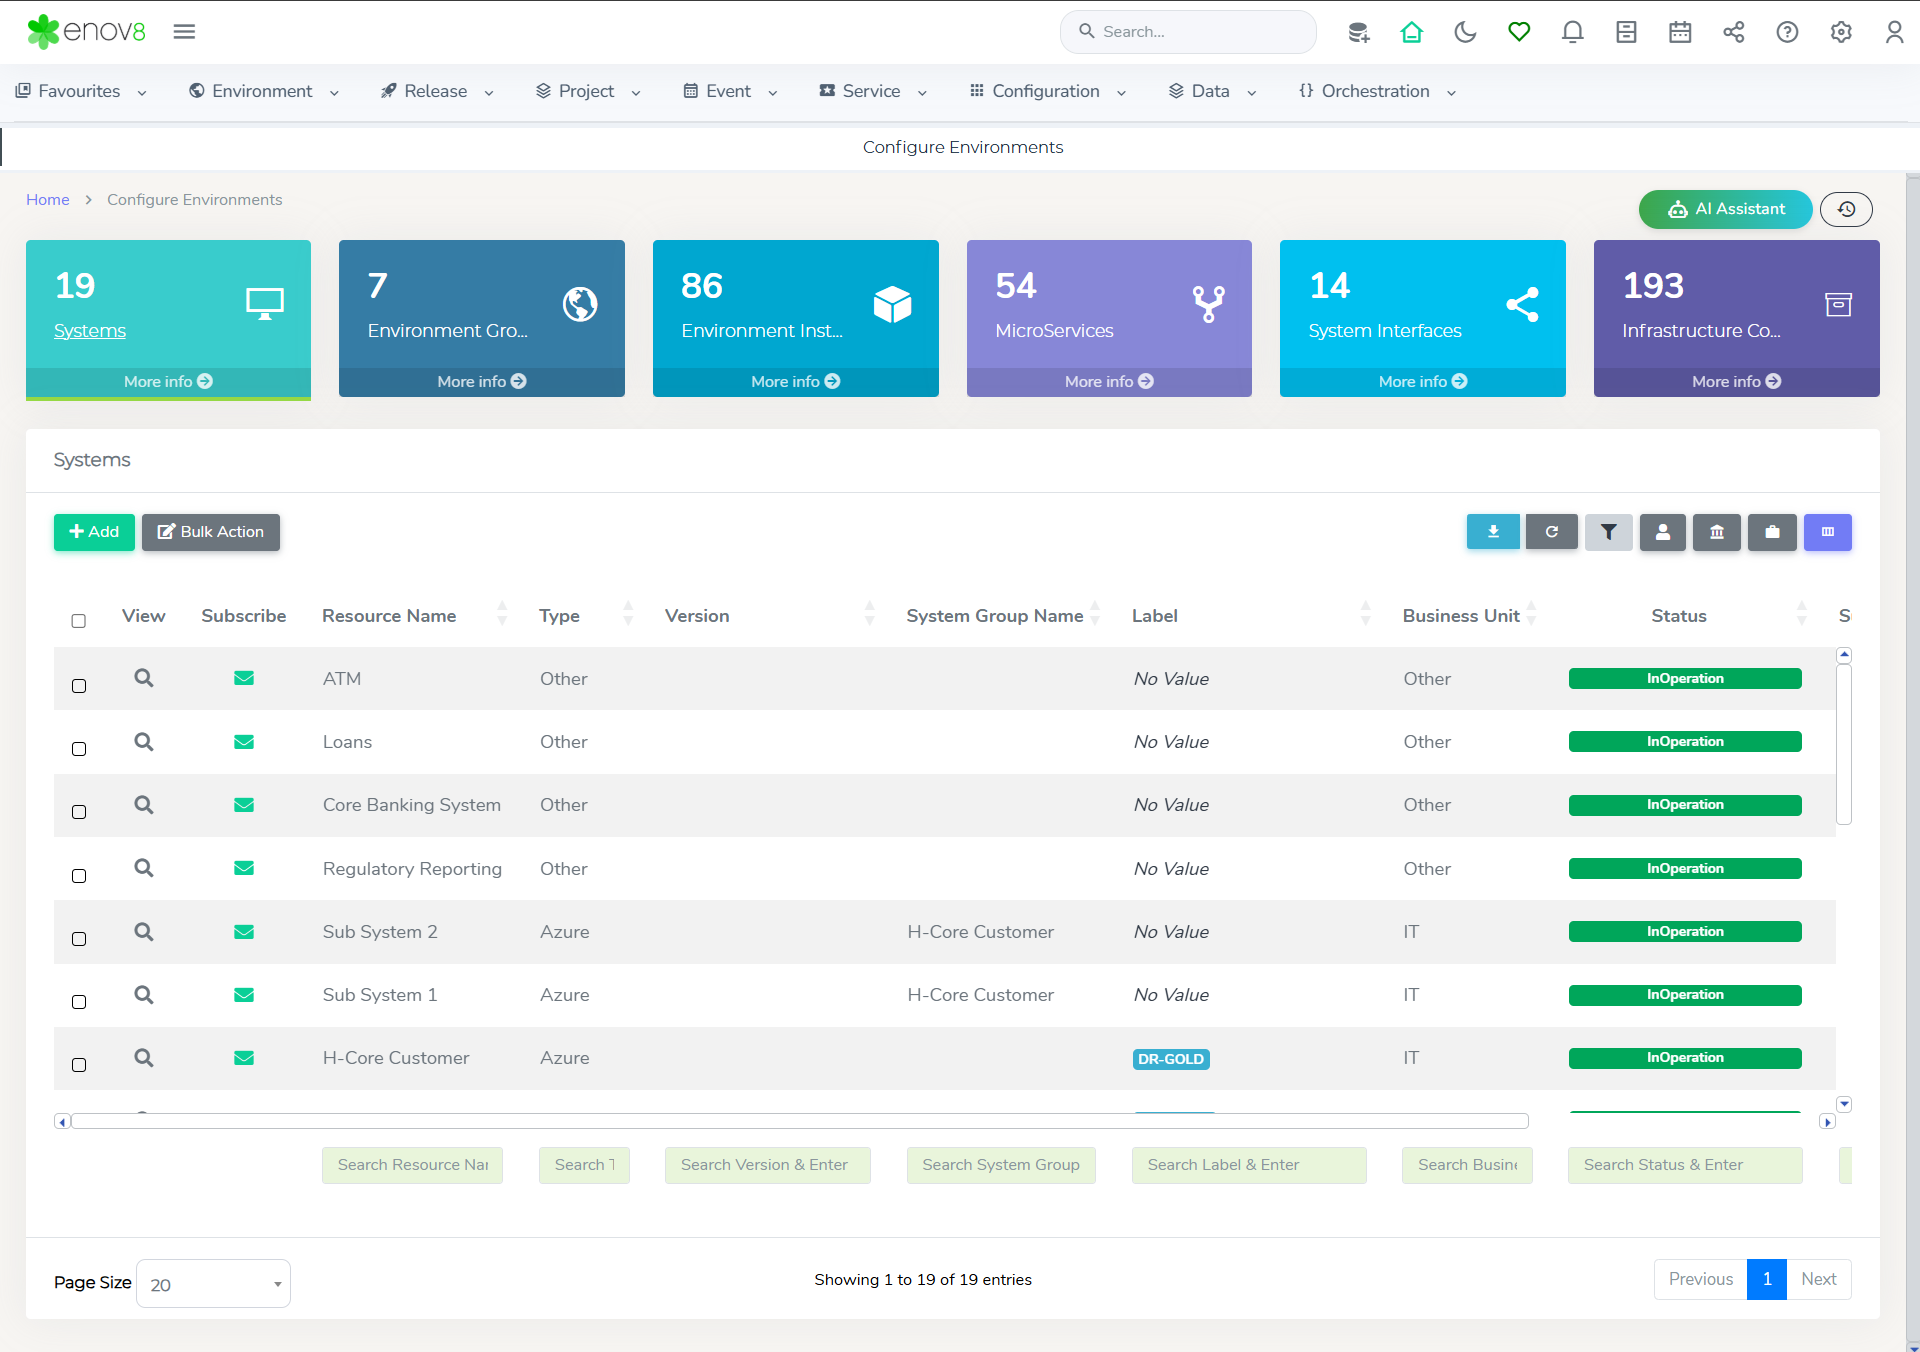
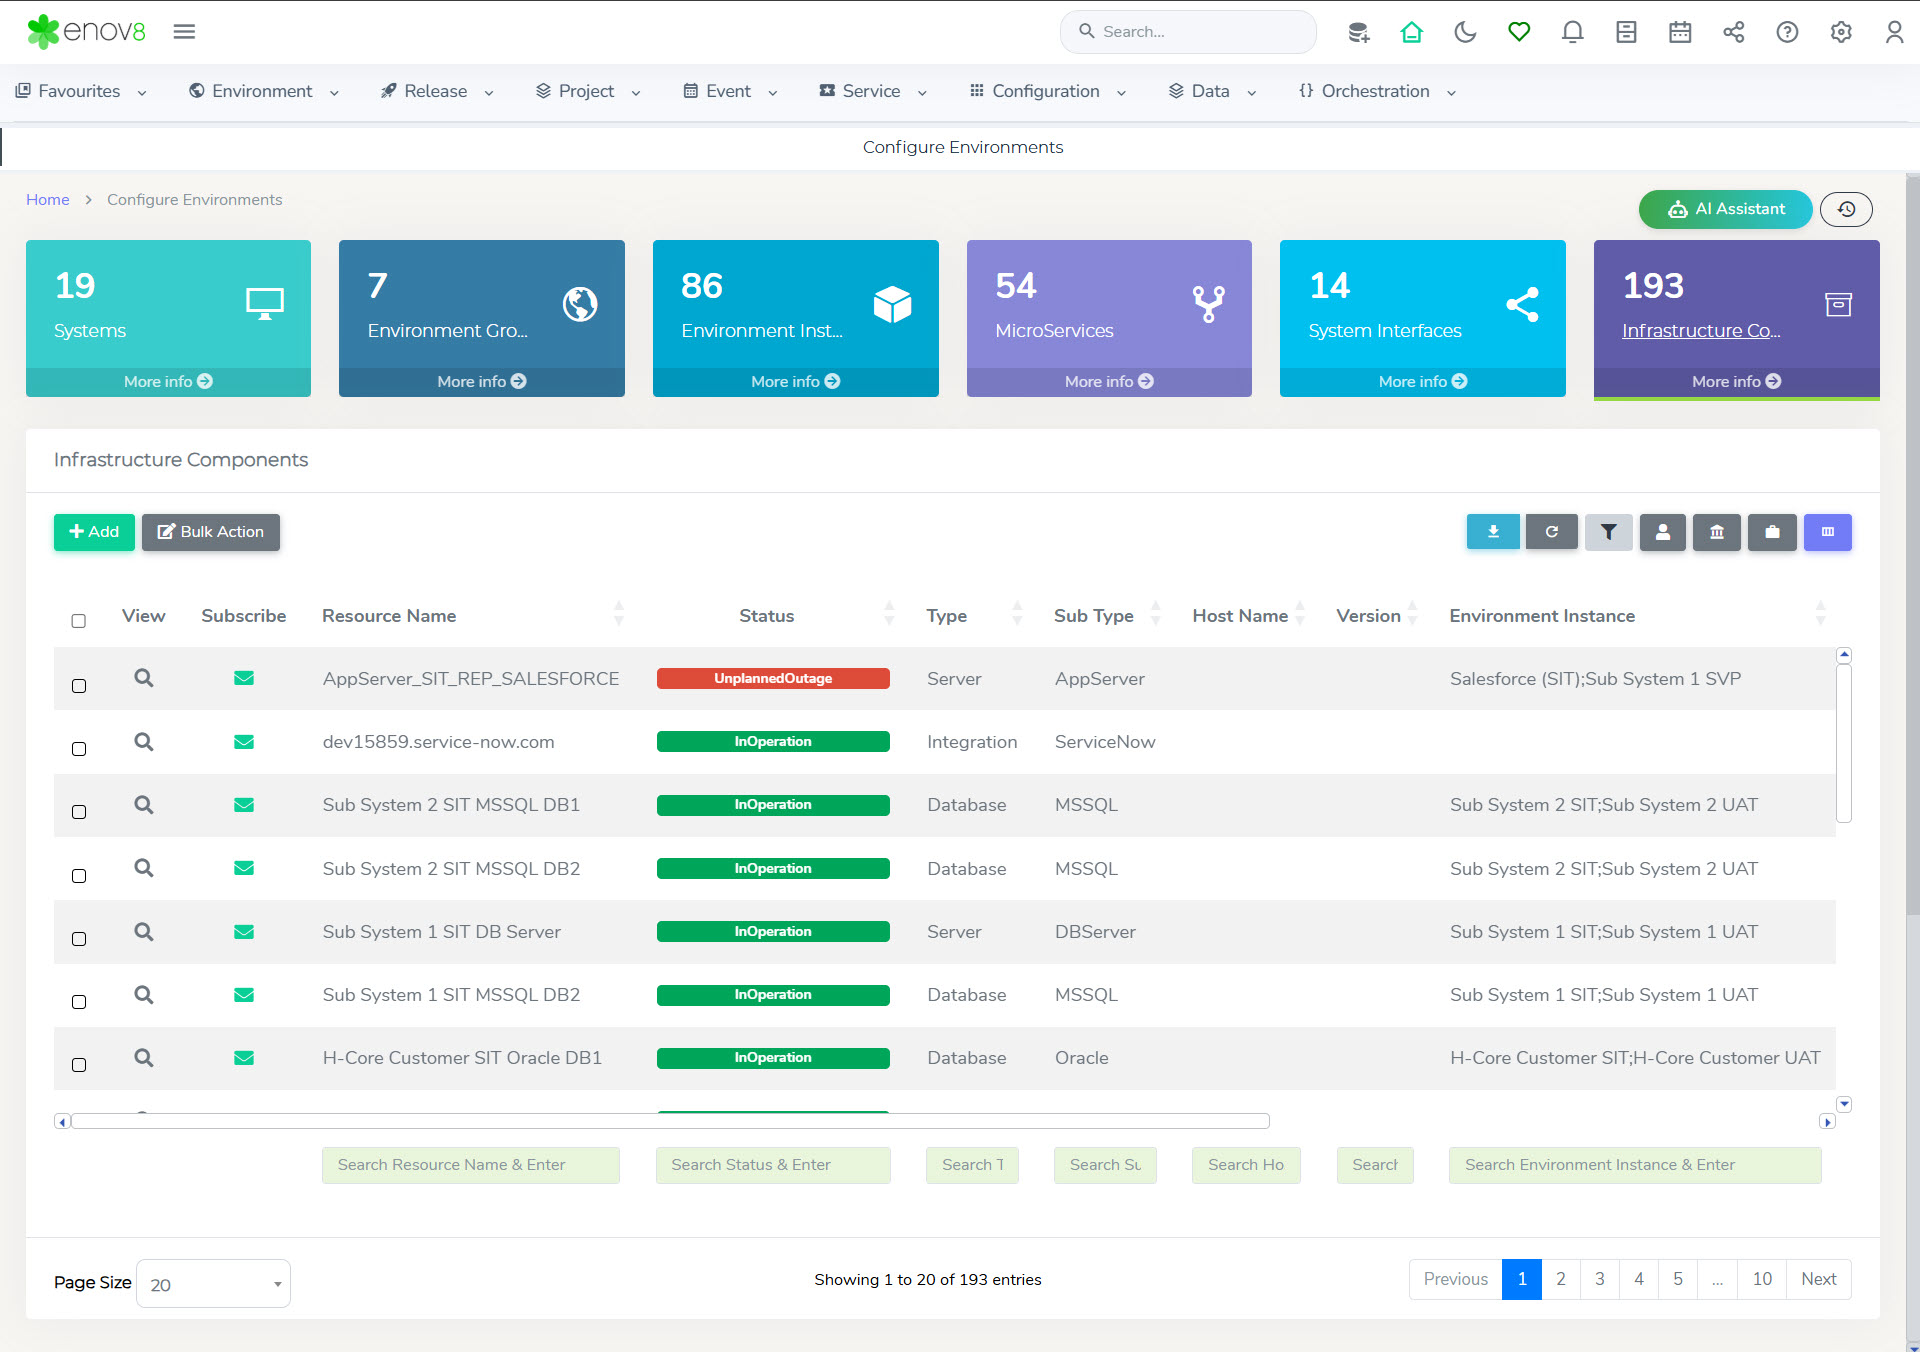
To manage and configure your environment configuration items (CI), follow these steps:
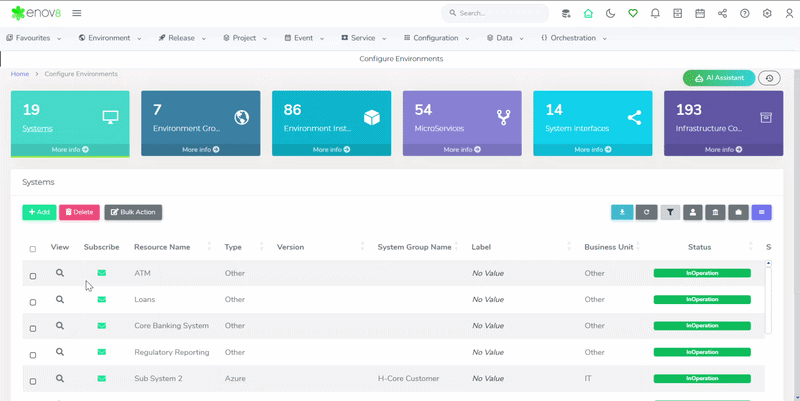
- Go to the Environment > Management > Configure Environments section in the platform.
- At the top of the screen, you'll see tiles representing different Configuration Item (CI) types.
- To view a specific type of CI in the grid below, click on the corresponding tile at the top.
- To add a new CI, simply click the Add button associated with the relevant CI category in the listing.
Within the Grid’s toolbar, you can:
- Add a new CI of the type currently listed.
- My Items: Filters the grid by items you have created.
- Assigned Items: Filters the grid by items assigned to yourself or a User Group you are part of.
- Download: Saves an excel copy of the currently viewed objects to your computer.
- Columns: This option allows to hide or show columns in the report.
Adding Systems
Within the Configure Environments screen click Add on the Systems listing area.
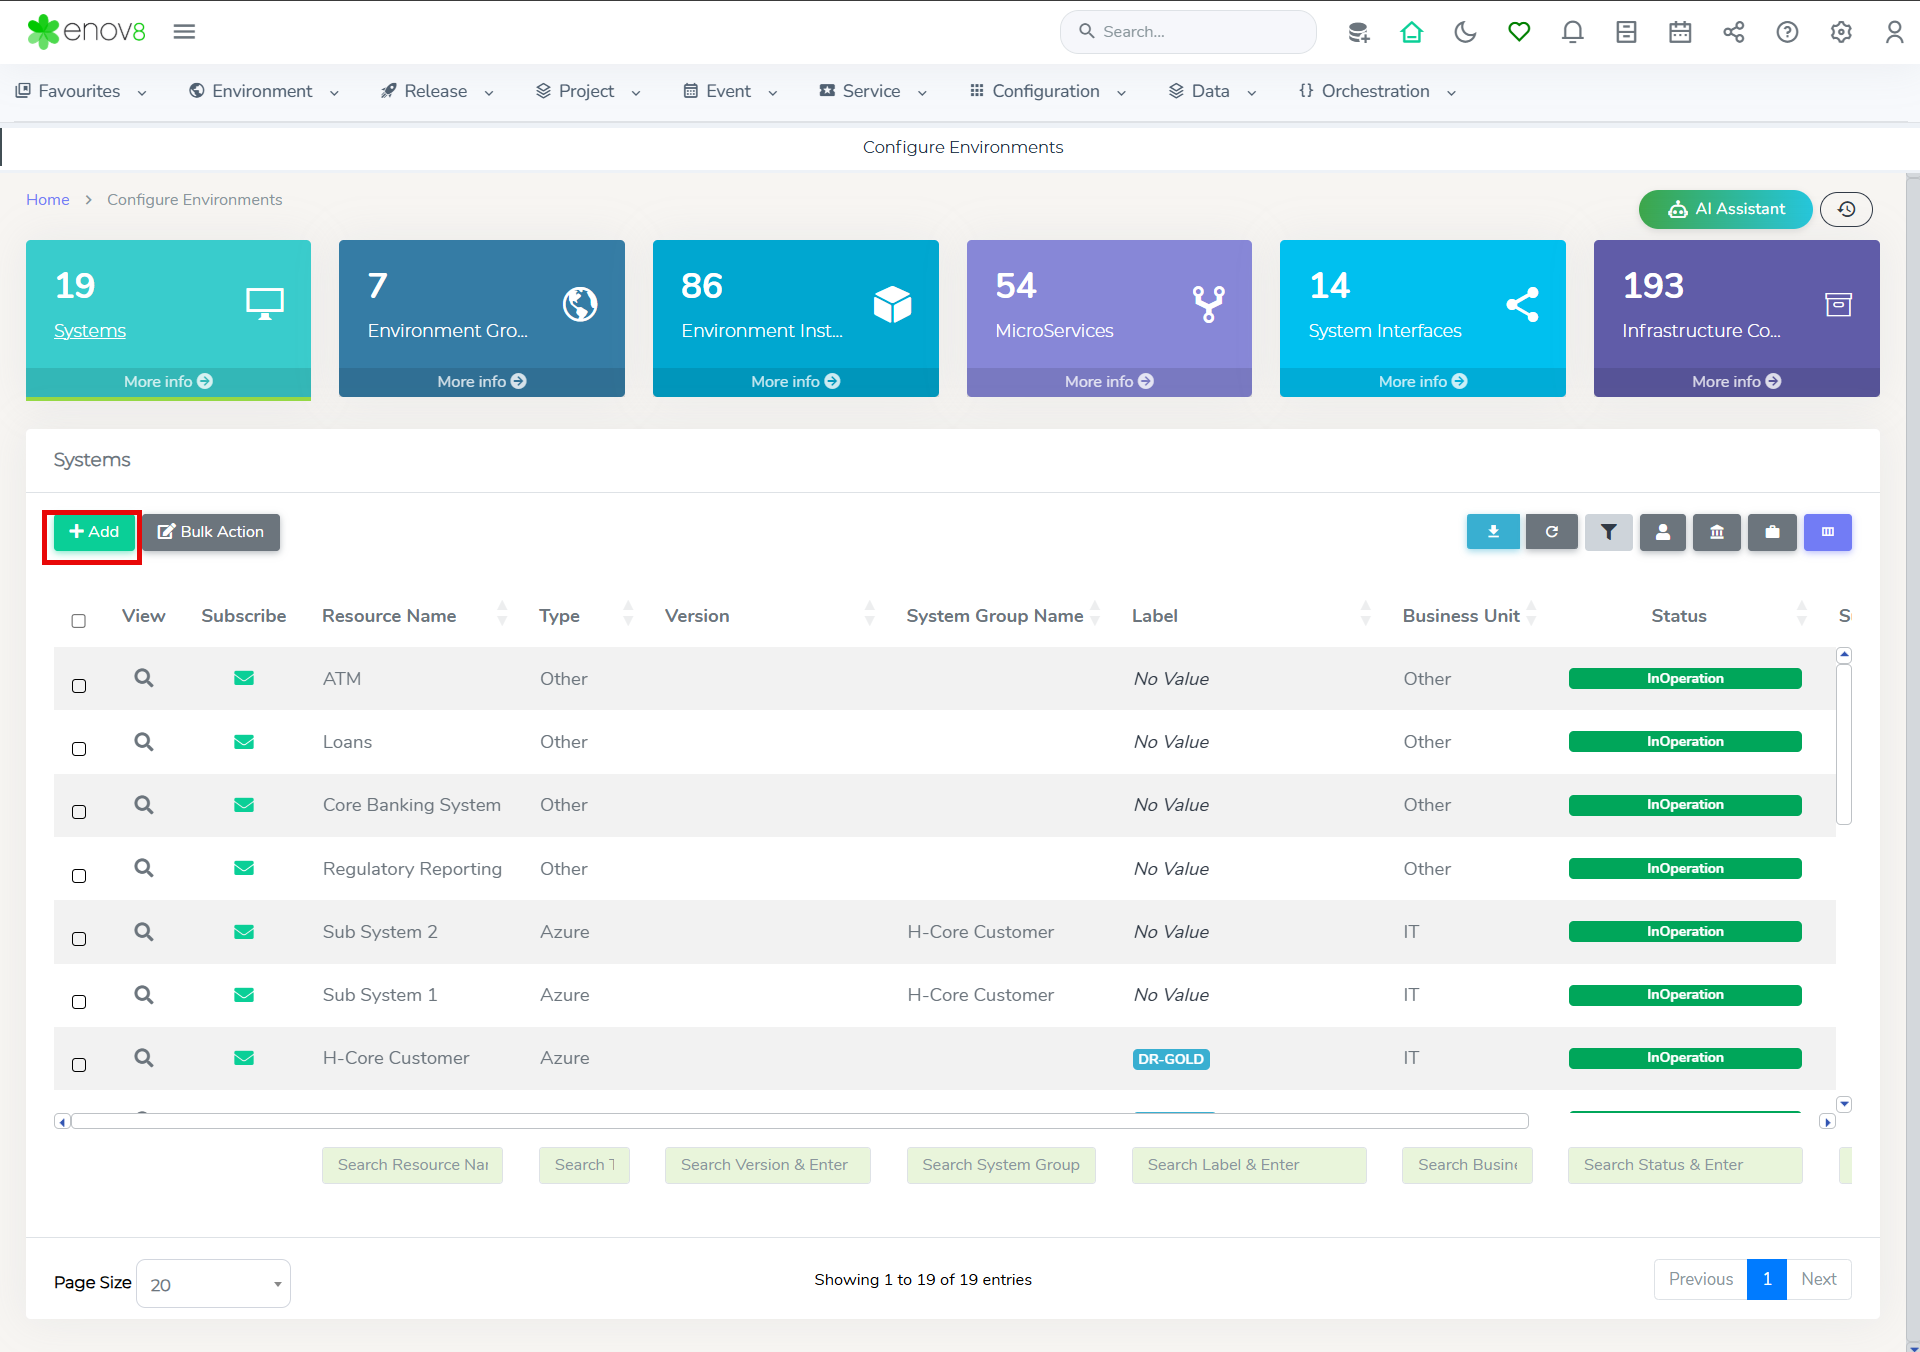
This will open the “Onboarding Form” popup to add a new System.
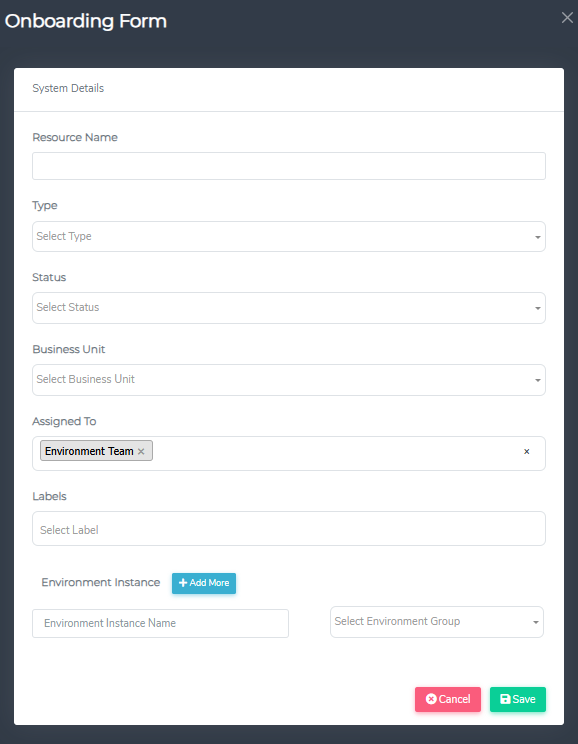
System Details
Each system entry must include the following essential information:
- Resource Name: System Name.
- Type: Type of application e.g., Mainframe.
- Status: e.g., Provisioning (New) InOperation (Used), or Decommissioned (Unused/Historical).
- Business Unit: Department belongs to.
- Assigned To: User Group(s) that have permission to modify this CI object. (This is automatically connected to your Default Test Environment User Group as configured by your Admin.)
Optional Fields
Additional details can be provided to enhance the tracking and management of the system:
- Labels:Apply labels to offer additional categorization that assists in identifying systems based on specific criteria.
Leverage labels to classify your systems effectively! By assigning labels, you can organize and categorize your systems, making it easier to manage and identify them. This simple yet powerful feature can enhance your workflow and system navigation, so start incorporating labels today to experience improved clarity and efficiency in your Environment.
- Environment Instance: Click ‘Add More’ to specify instances of the system in different environments.
Once finished adding you can click the Green Submit button to Save and Submit the CI object or cancel to undo/lose any changes.
Adding Environment Groups
Within the Configure Environments screen click Add on the Environment Group listing area.
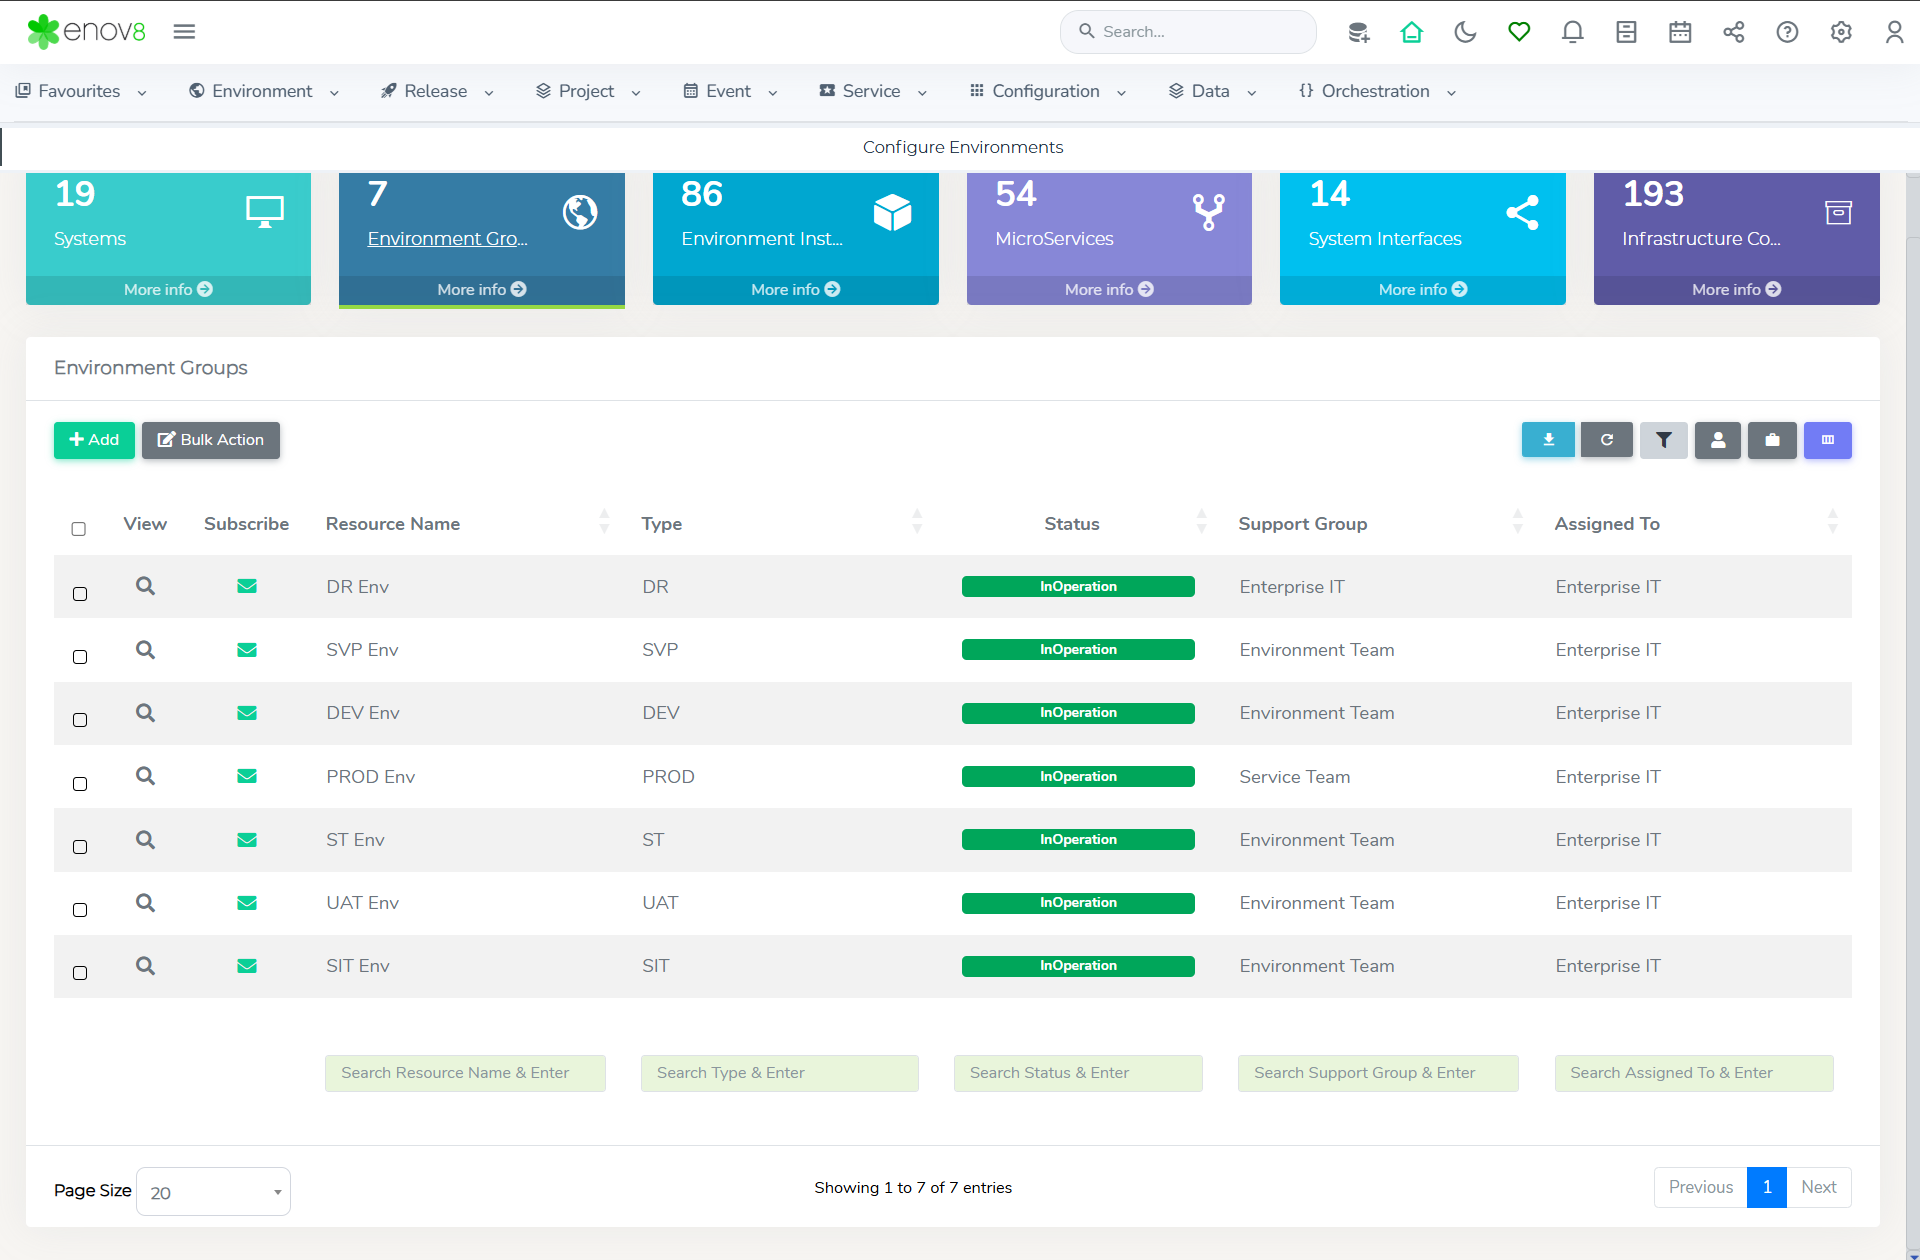
This will open the “Onboarding Form” popup to add a new Environment Group.
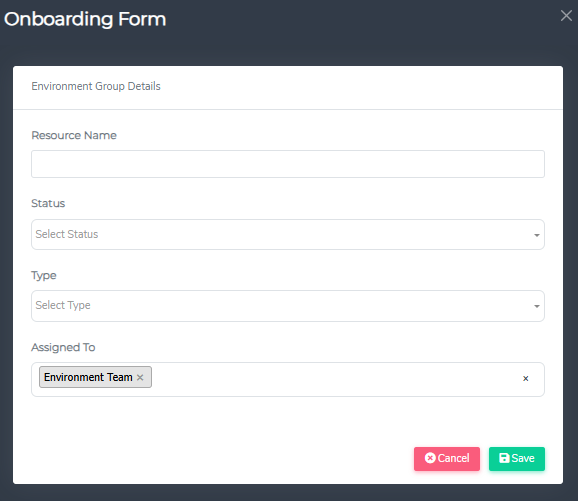
Environment Group requires the following information:
- Resource Name: Environment Group Name.
- Status: Environment Group Health.
- Type: The stage of the software delivery lifecycle that this environment is typically purposed for. e.g., DEV, SIT, UAT, etc
- Assigned To: User Group(s) that have permission to modify this CI object. (This is automatically connected to your Default Test Environment User Group as configured by your Admin.)
Once finished adding/editing you can click the Green Submit button to Save and Submit the CI object or Cancel to undo/lose any changes.
Adding Environment Instances
Within the Configure Environments screen click Add on the Environment Instance listing area.
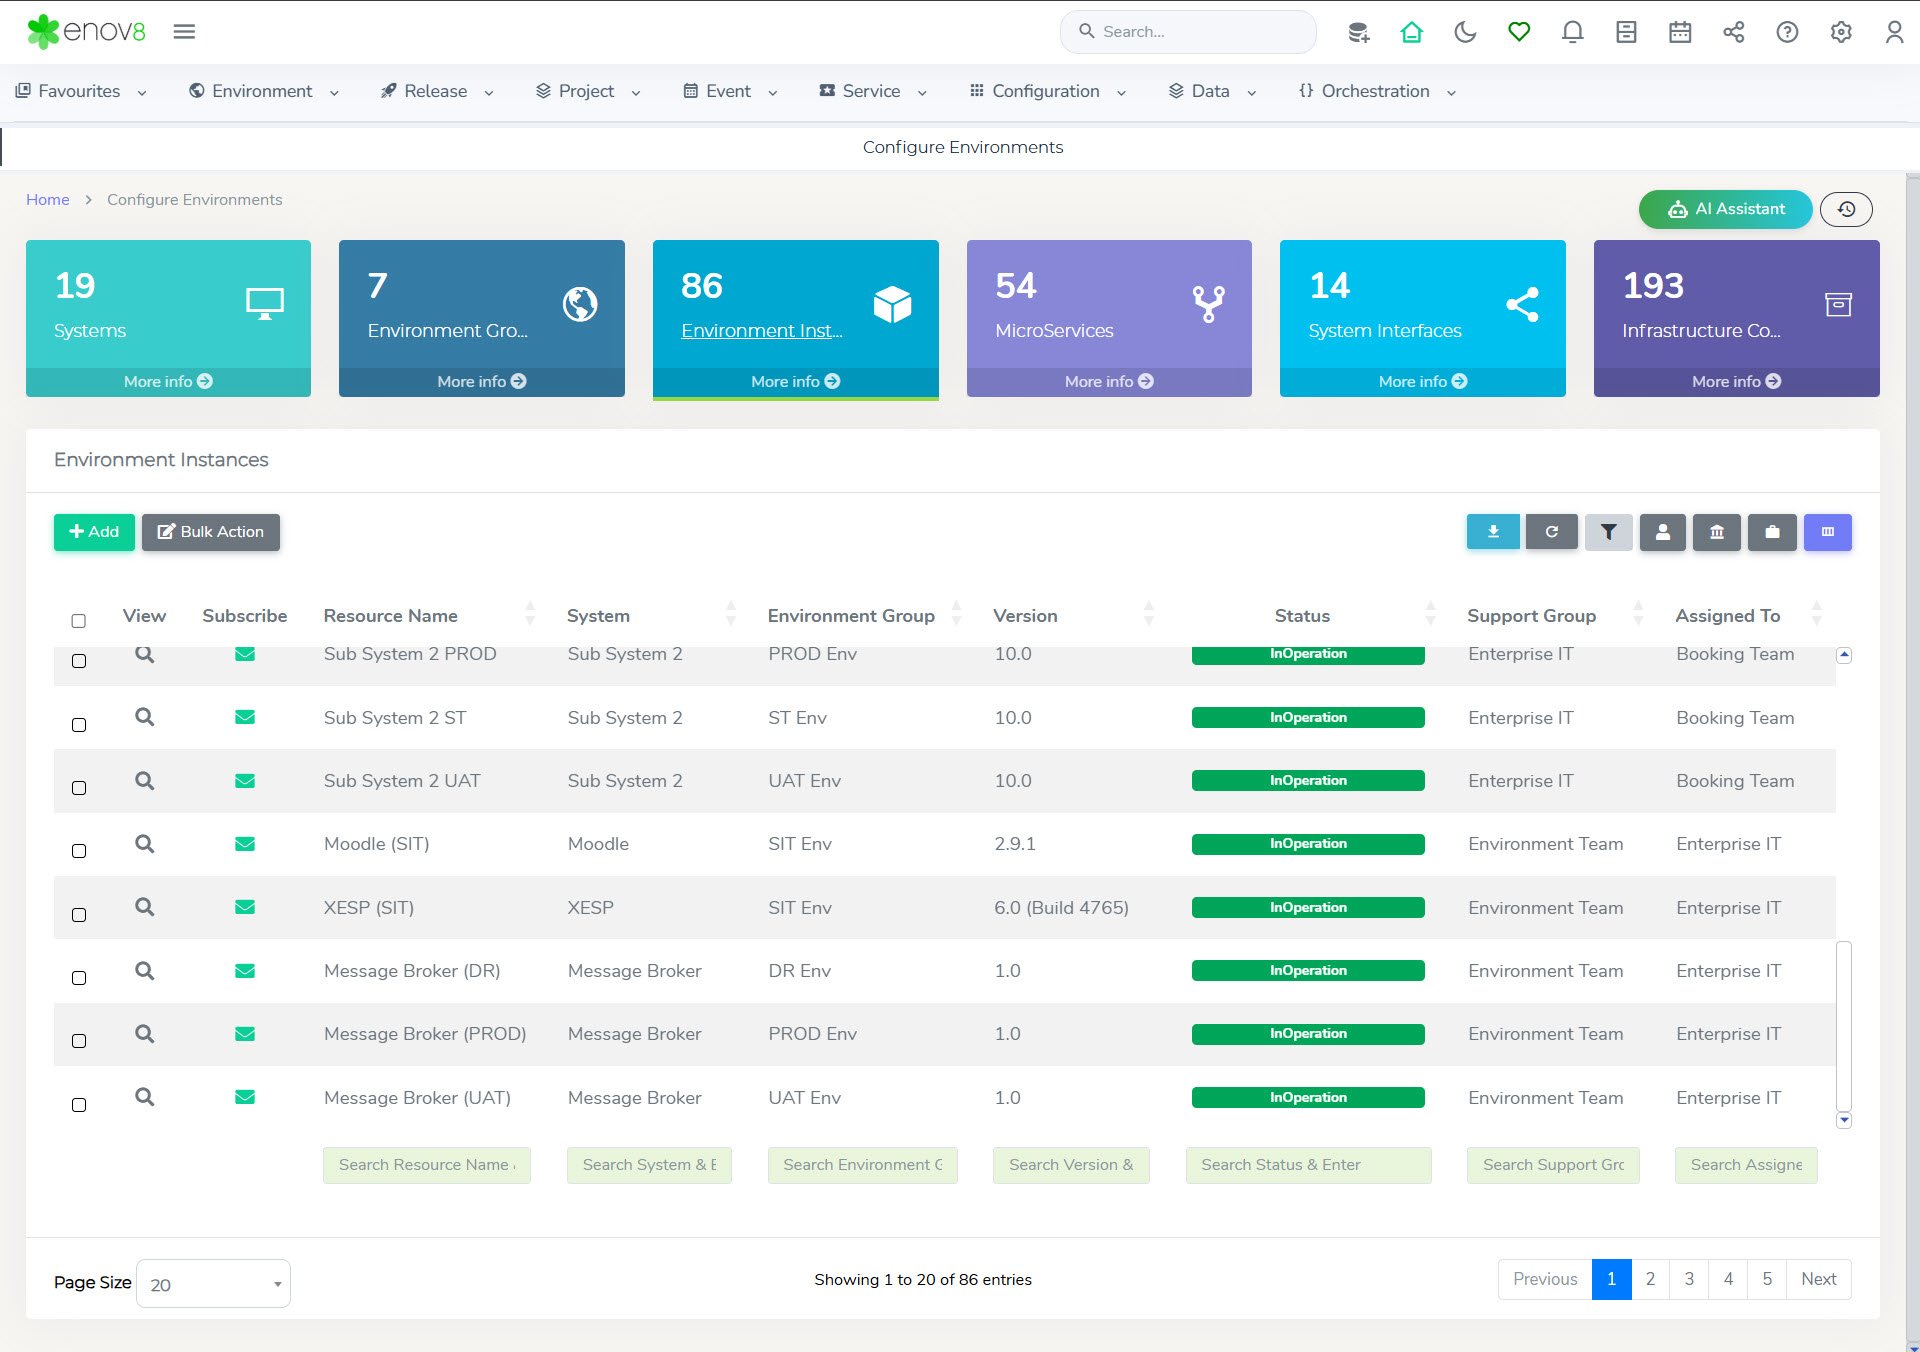
This will open the “Onboarding Form” popup to add a new Environment Instance.
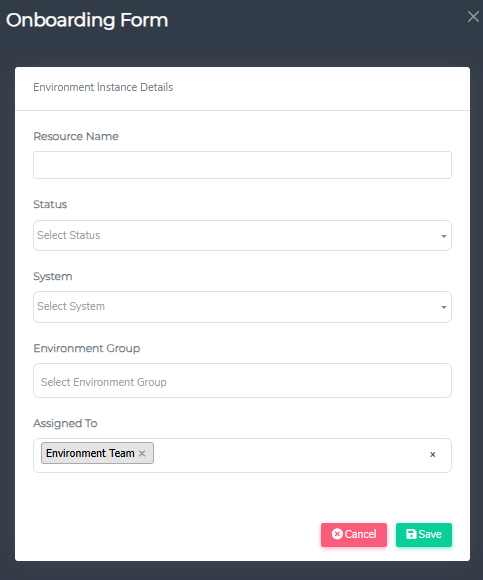
Environment Instance Instances require the following information:
- Resource Name: Environment Instance Name.
- Status: Environment Instance Health.
- System: System this instance relates to
- Environment Group: The Environment Group this instance is a part of.
- Assigned To: User Group(s) that have permission to modify this CI object. (This is automatically connected to your Default Test Environment User Group as configured by your Admin.)
Once finished adding you can click the Green Submit button to Save and Submit the CI object or cancel to undo/lose any changes.
Adding Infrastructure Components
Within the Configure Environments screen click Add on the Infrastructure Components listing.
This will open the “Onboarding Form” popup to add a new Infrastructure Component.
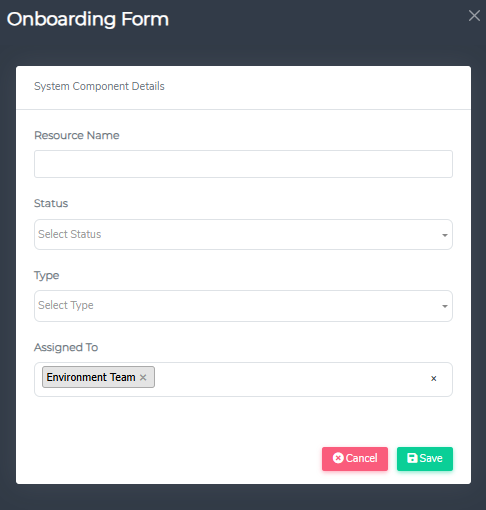
Infrastructure Components require the following information:
- Resource Name: Server / Component Name
- Status: Server / Component Health.
- Type: e.g., Database
- Assigned To: User Group(s) that have permission to modify this CI object. (This is automatically connected to your Default Test Environment User Group as configured by your Admin.)
Once finished adding you can click the Green Submit button to Save and Submit the CI object or cancel to undo/lose any changes.
Managing Dependencies (System)
The connectivity relationships or “Dependencies” between Systems can be modelled and managed simply via the Environment > Management > Manage Dependencies.
In this screen you can select System you would like to view and manage dependencies for.
The vertically aligned list on the left is the Source and the horizontally aligned list on the top are the Target systems.
The example in the below screenshot is showing adding a Web Service dependency from Salesforce to MIS.
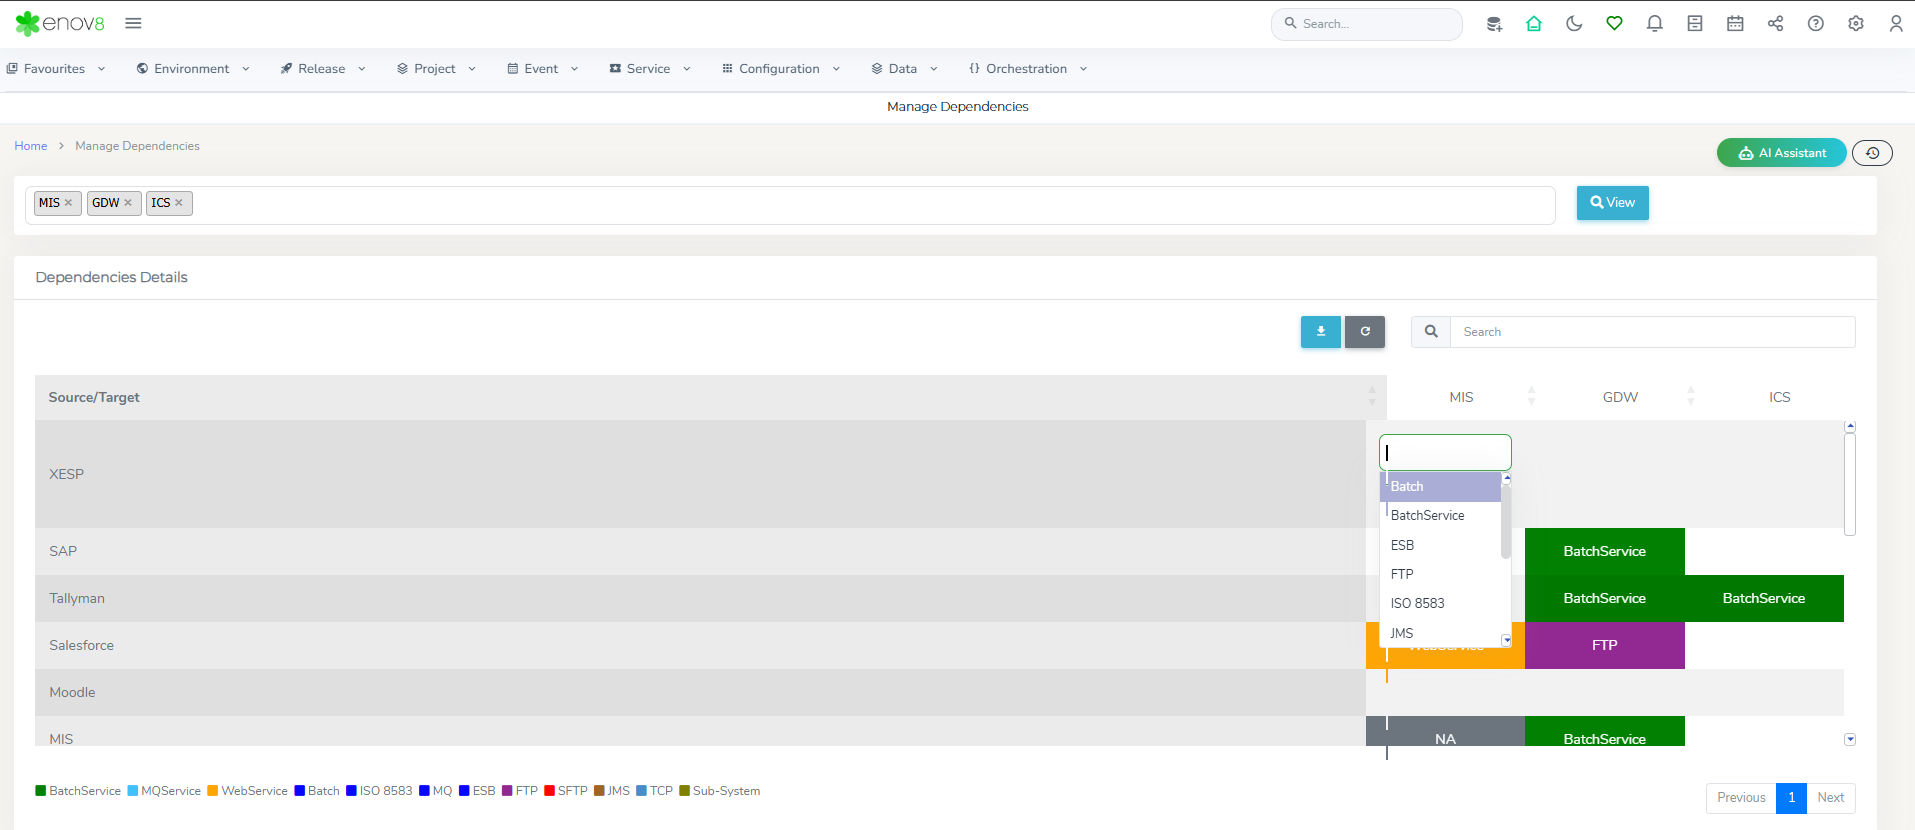
Typically, System dependencies would be utilised to depict connectivity in “Production”. The System dependencies data will be inherited by the Environment & System Instance dependency views.
Managing Tags
Tags are a simple but powerful means of collecting various “Key Value Pair” information. Reporting or modelling can be generated based on tag information.
All Configuration Items can have Tags attached. Tags can be managed via Environment > Management > Manage Tags.
Tags can also come from an organisation’s various sources of truth via integration with these source systems. (e.g., VMWare, AWS, Azure, DevOps tools, etc)
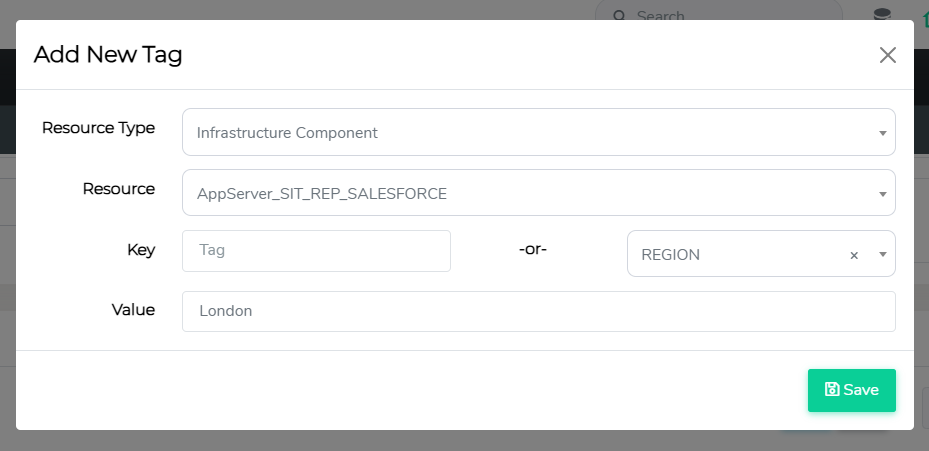
Tags can also be added by clicking the Add Tag button.
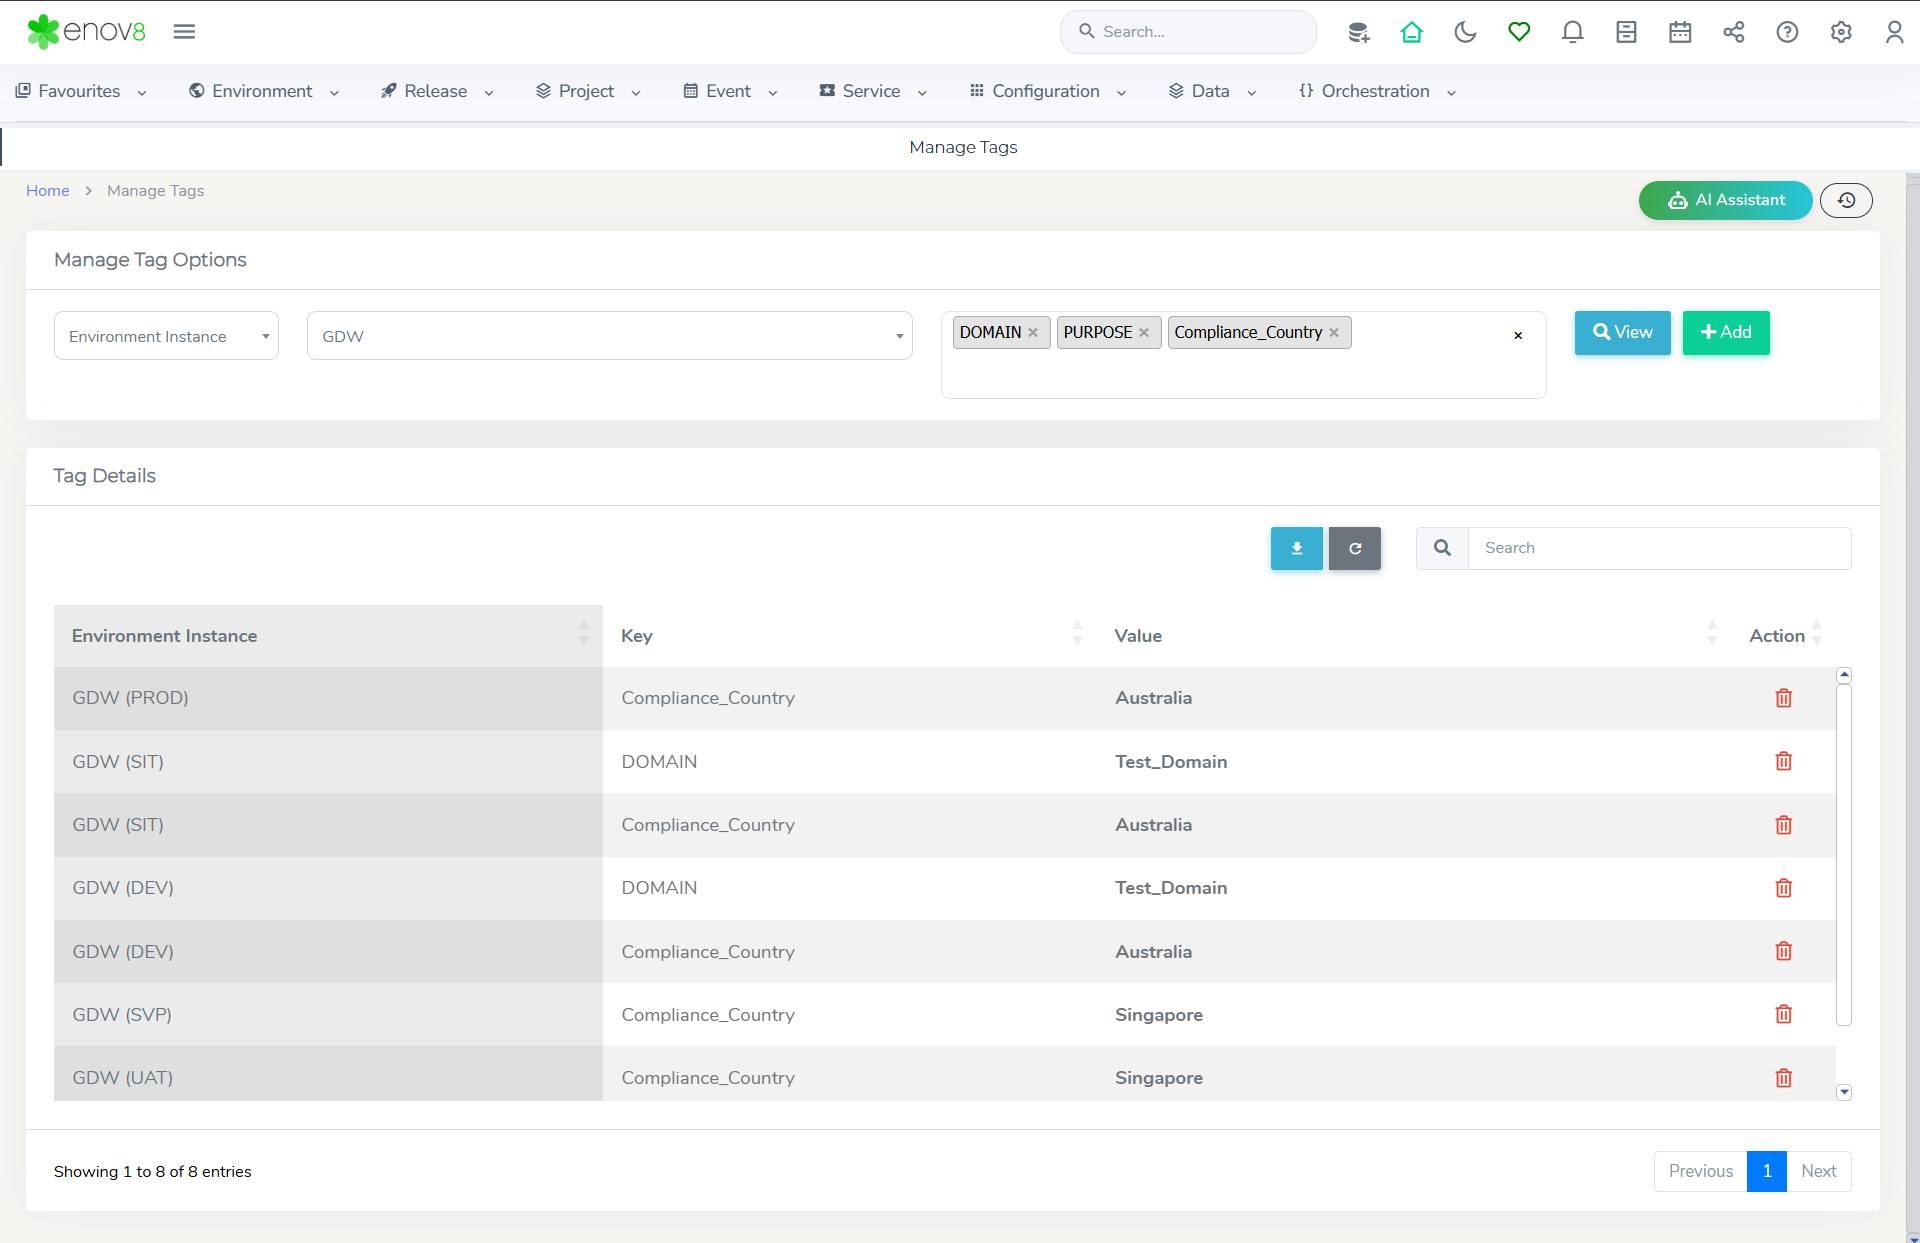
A popup form will then be shown where you can select the Resource (Configuration Item) you wish to attach the Tag to and enter the Key and Value details for the Tag.
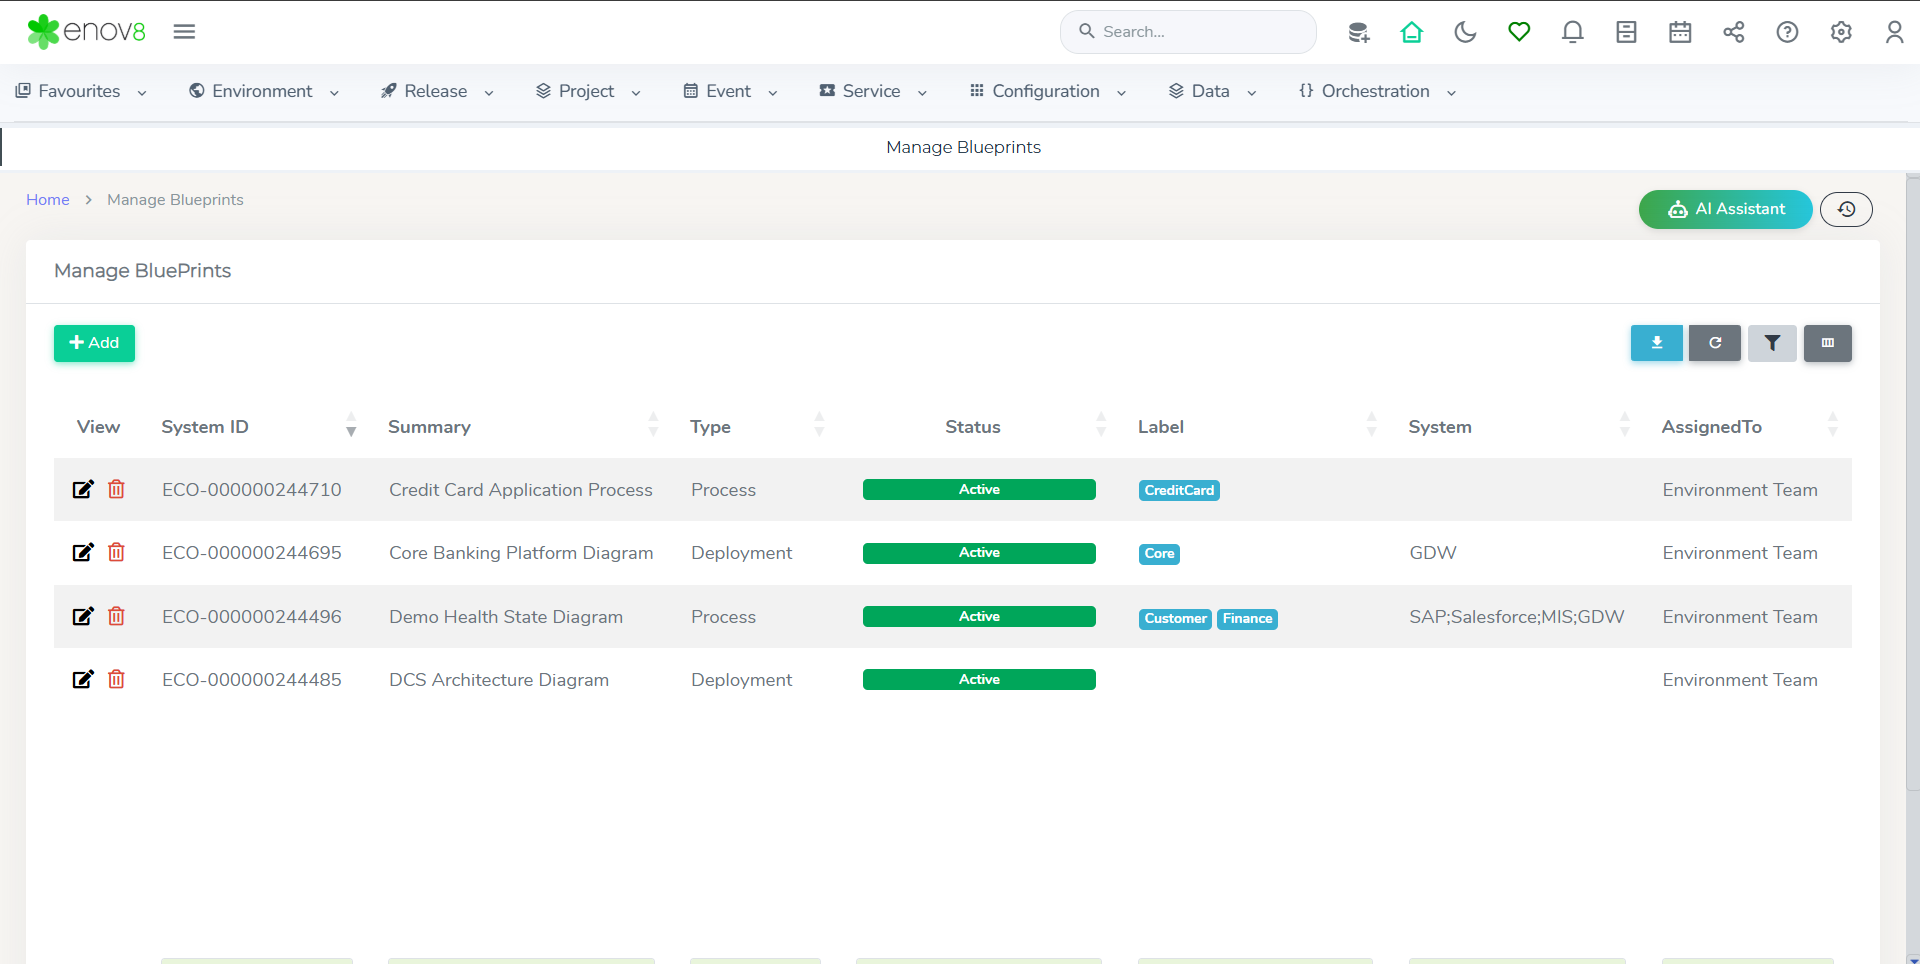
Managing Blueprints
Blueprints serve as a valuable tool for visually modeling IT architecture, business processes, and IT services, such as the GDW Deployment Diagram.
To create or modify these diagrams, please follow these steps:
- Access the blueprint management area by selecting Environment > Management > Manage Blueprints in the platform.
- To start a new diagram or update an existing one, click the Add or Edit button.
These steps will guide you through the process of efficiently creating or updating your visual models, helping you better understand and communicate your IT and business structures.
To add a new object in the diagram, simply drag the icon from left toolbar. To Edit the properties of the object, simply click the object and properties will be visible in the right-hand side menu.
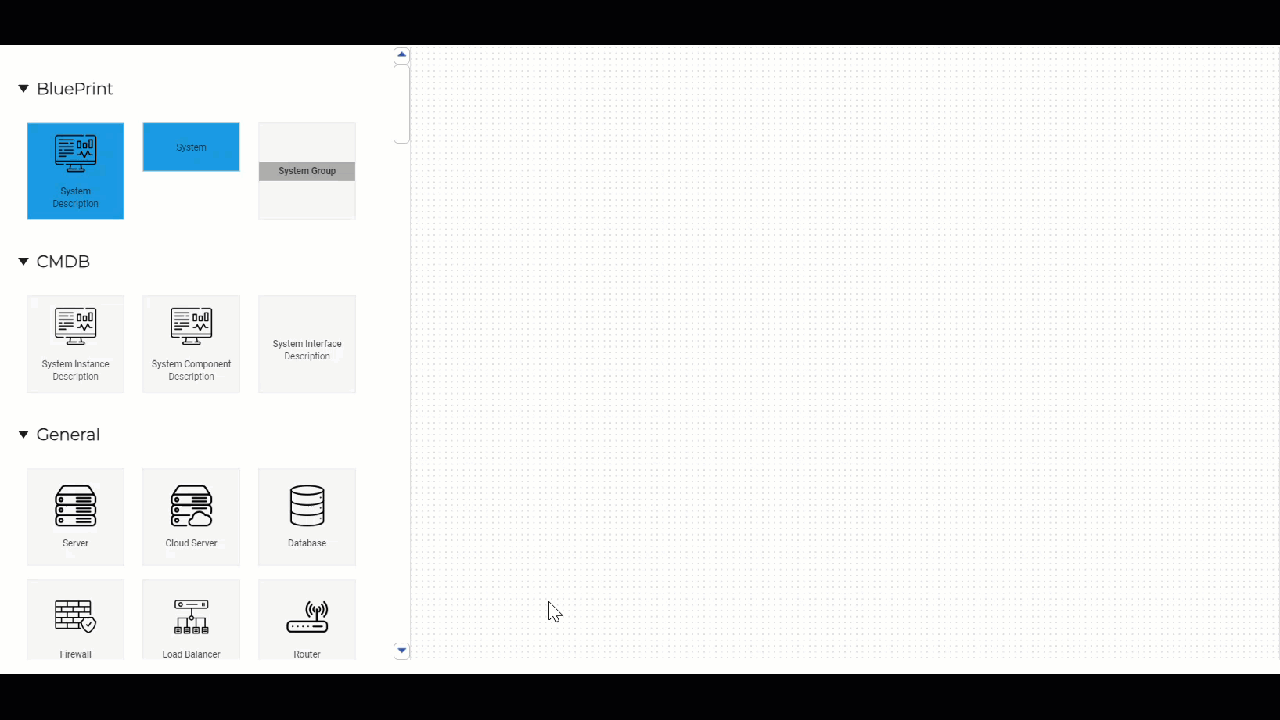
The "Sync & Save" feature allows you to create systems and dependencies based on your diagram. This function is specifically designed to work with objects dragged from the "BluePrint" section on the left side of the diagram toolbar.
Dashboards & Reports
In this section we’ll go through the various Environment Dashboards and Reports.
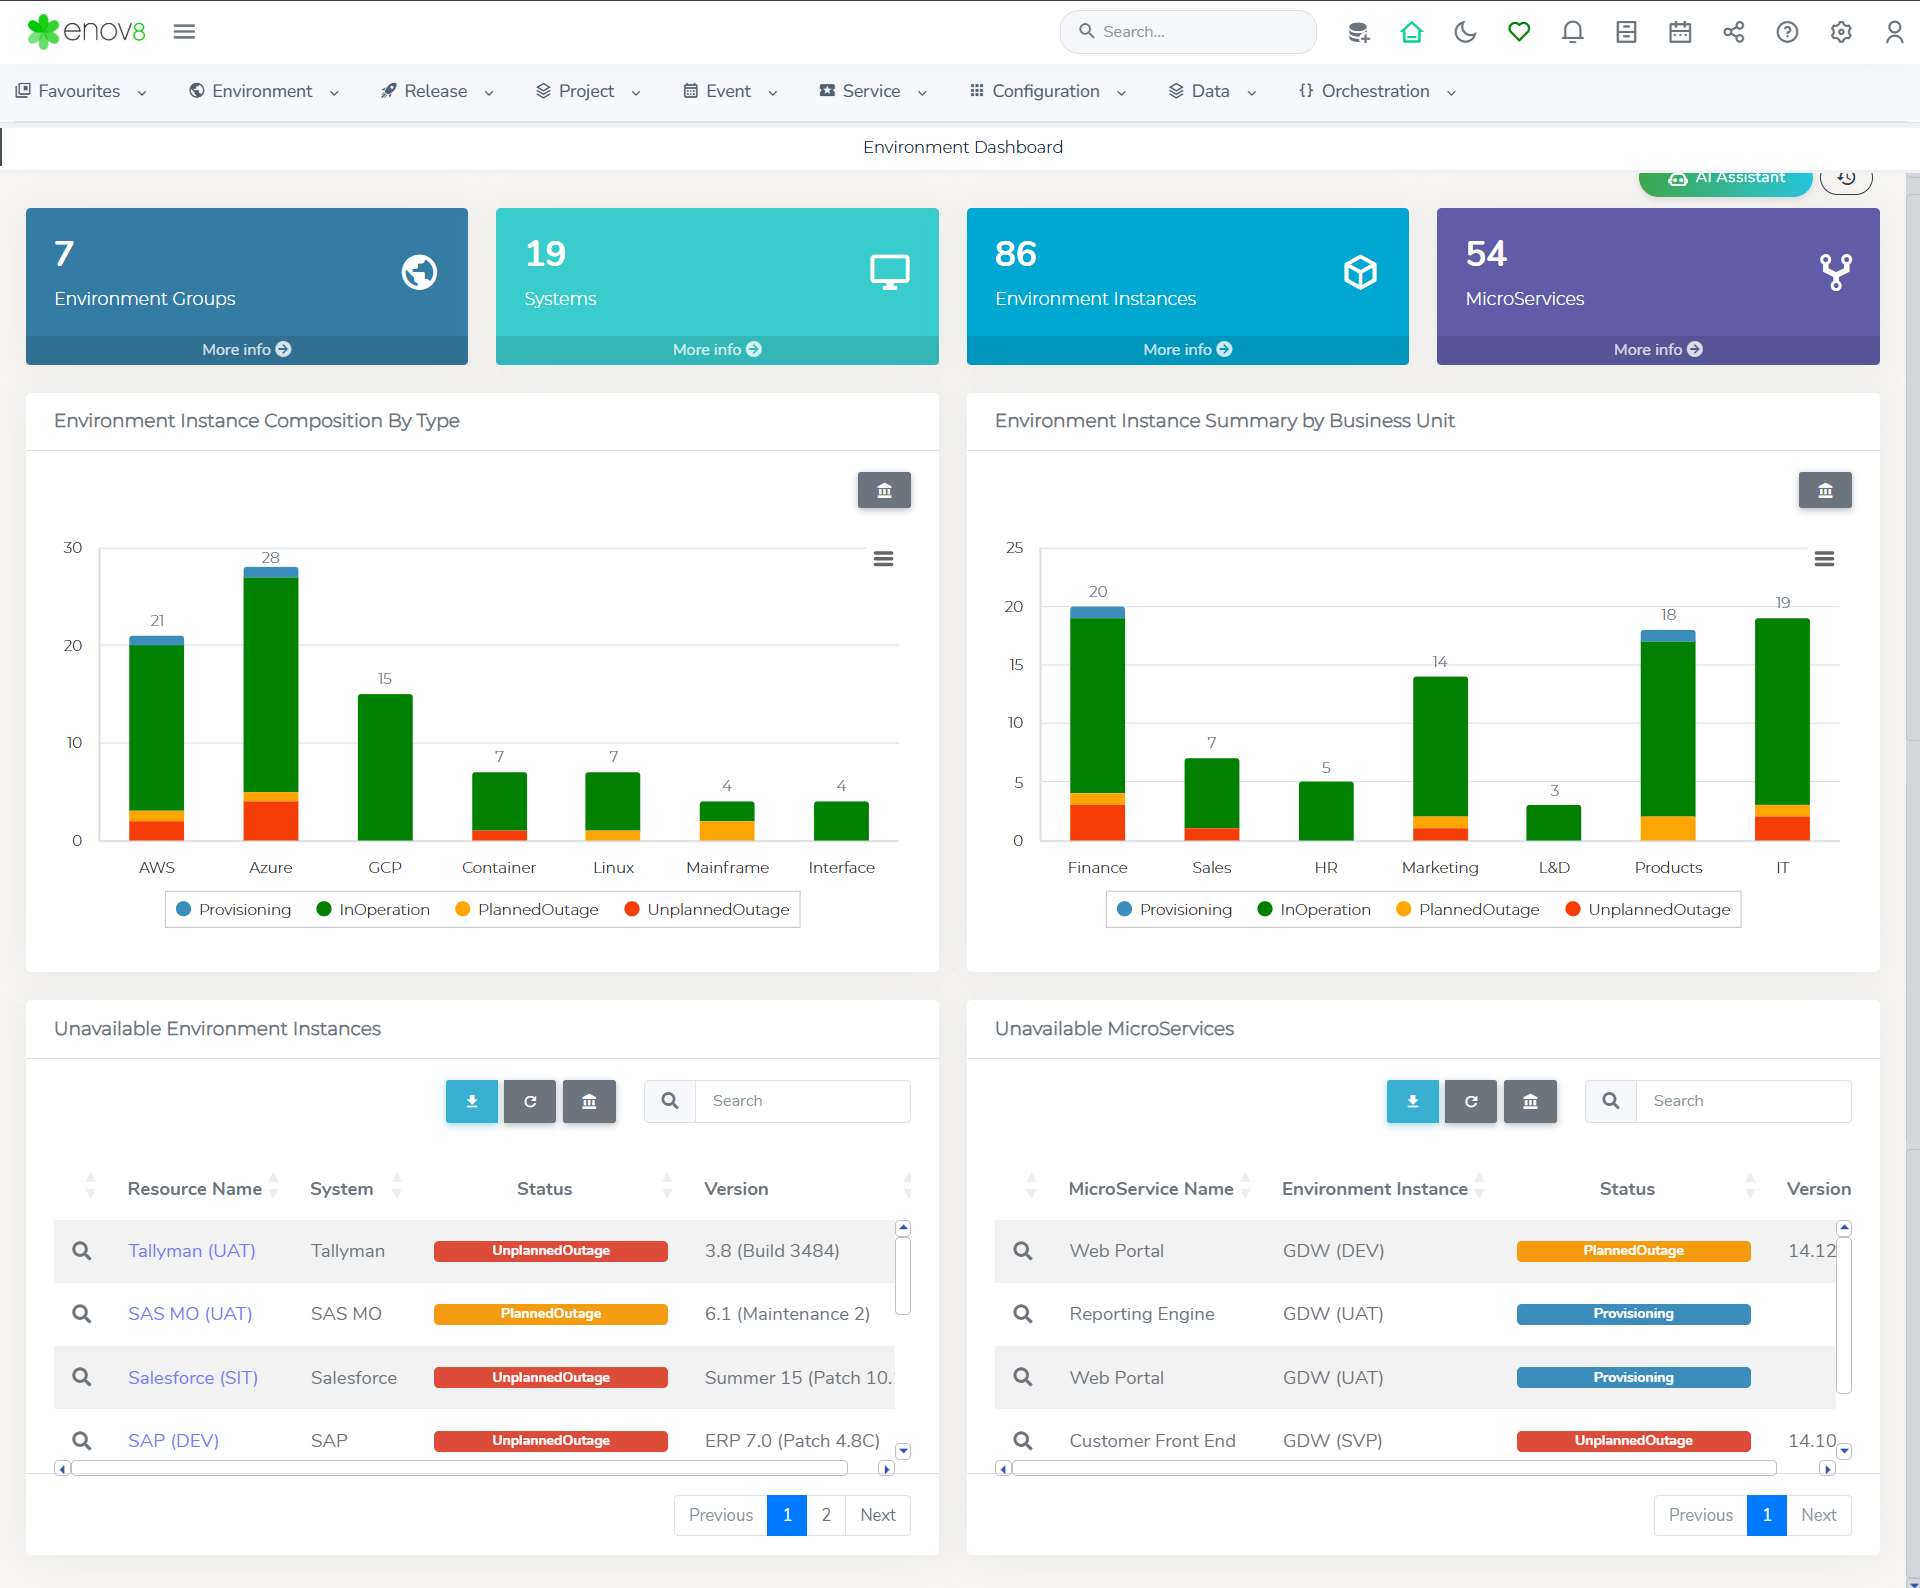
Environment Dashboard
The Environment Dashboard offers a comprehensive overview of your environmental landscape and their current statuses.
To view the dashboard, go to Environment > Home > Environment Dashboard.
- Environment Resources Under Management: At the top of the dashboard, various widgets display the total count of key Configuration Items (CIs) or environment resources you're managing, organized by CI type.
- Environment Instance Composition By Type: This chart illustrates the distribution of environment instances across different platforms (e.g., AWS, Azure, GCP), segmented by their status (e.g., Provisioning, InOperation, PlannedOutage, UnplannedOutage).
- Environment Instance Summary by Business Unit: This chart shows the availability of environment instances, sorted by business units (e.g., Finance, Sales, HR, Marketing, L&D, Products, IT).
- Unavailable Environment Instances and Infrastructure Components: A specific widget lists all the environment instances and Infrastructure Components currently unavailable.
Insights - Environment
The Environment Insights report in the Enov8 platform provides a comprehensive analysis of a selected environment group, detailing the health of Environment Instances, as well as providing an overview of recent and upcoming Environment Events and Bookings.
Accessing the Environment Insights Report
To view this report, follow these steps:
- Navigate to Environment.
- Click on Reports.
- Select Insight - Environment.
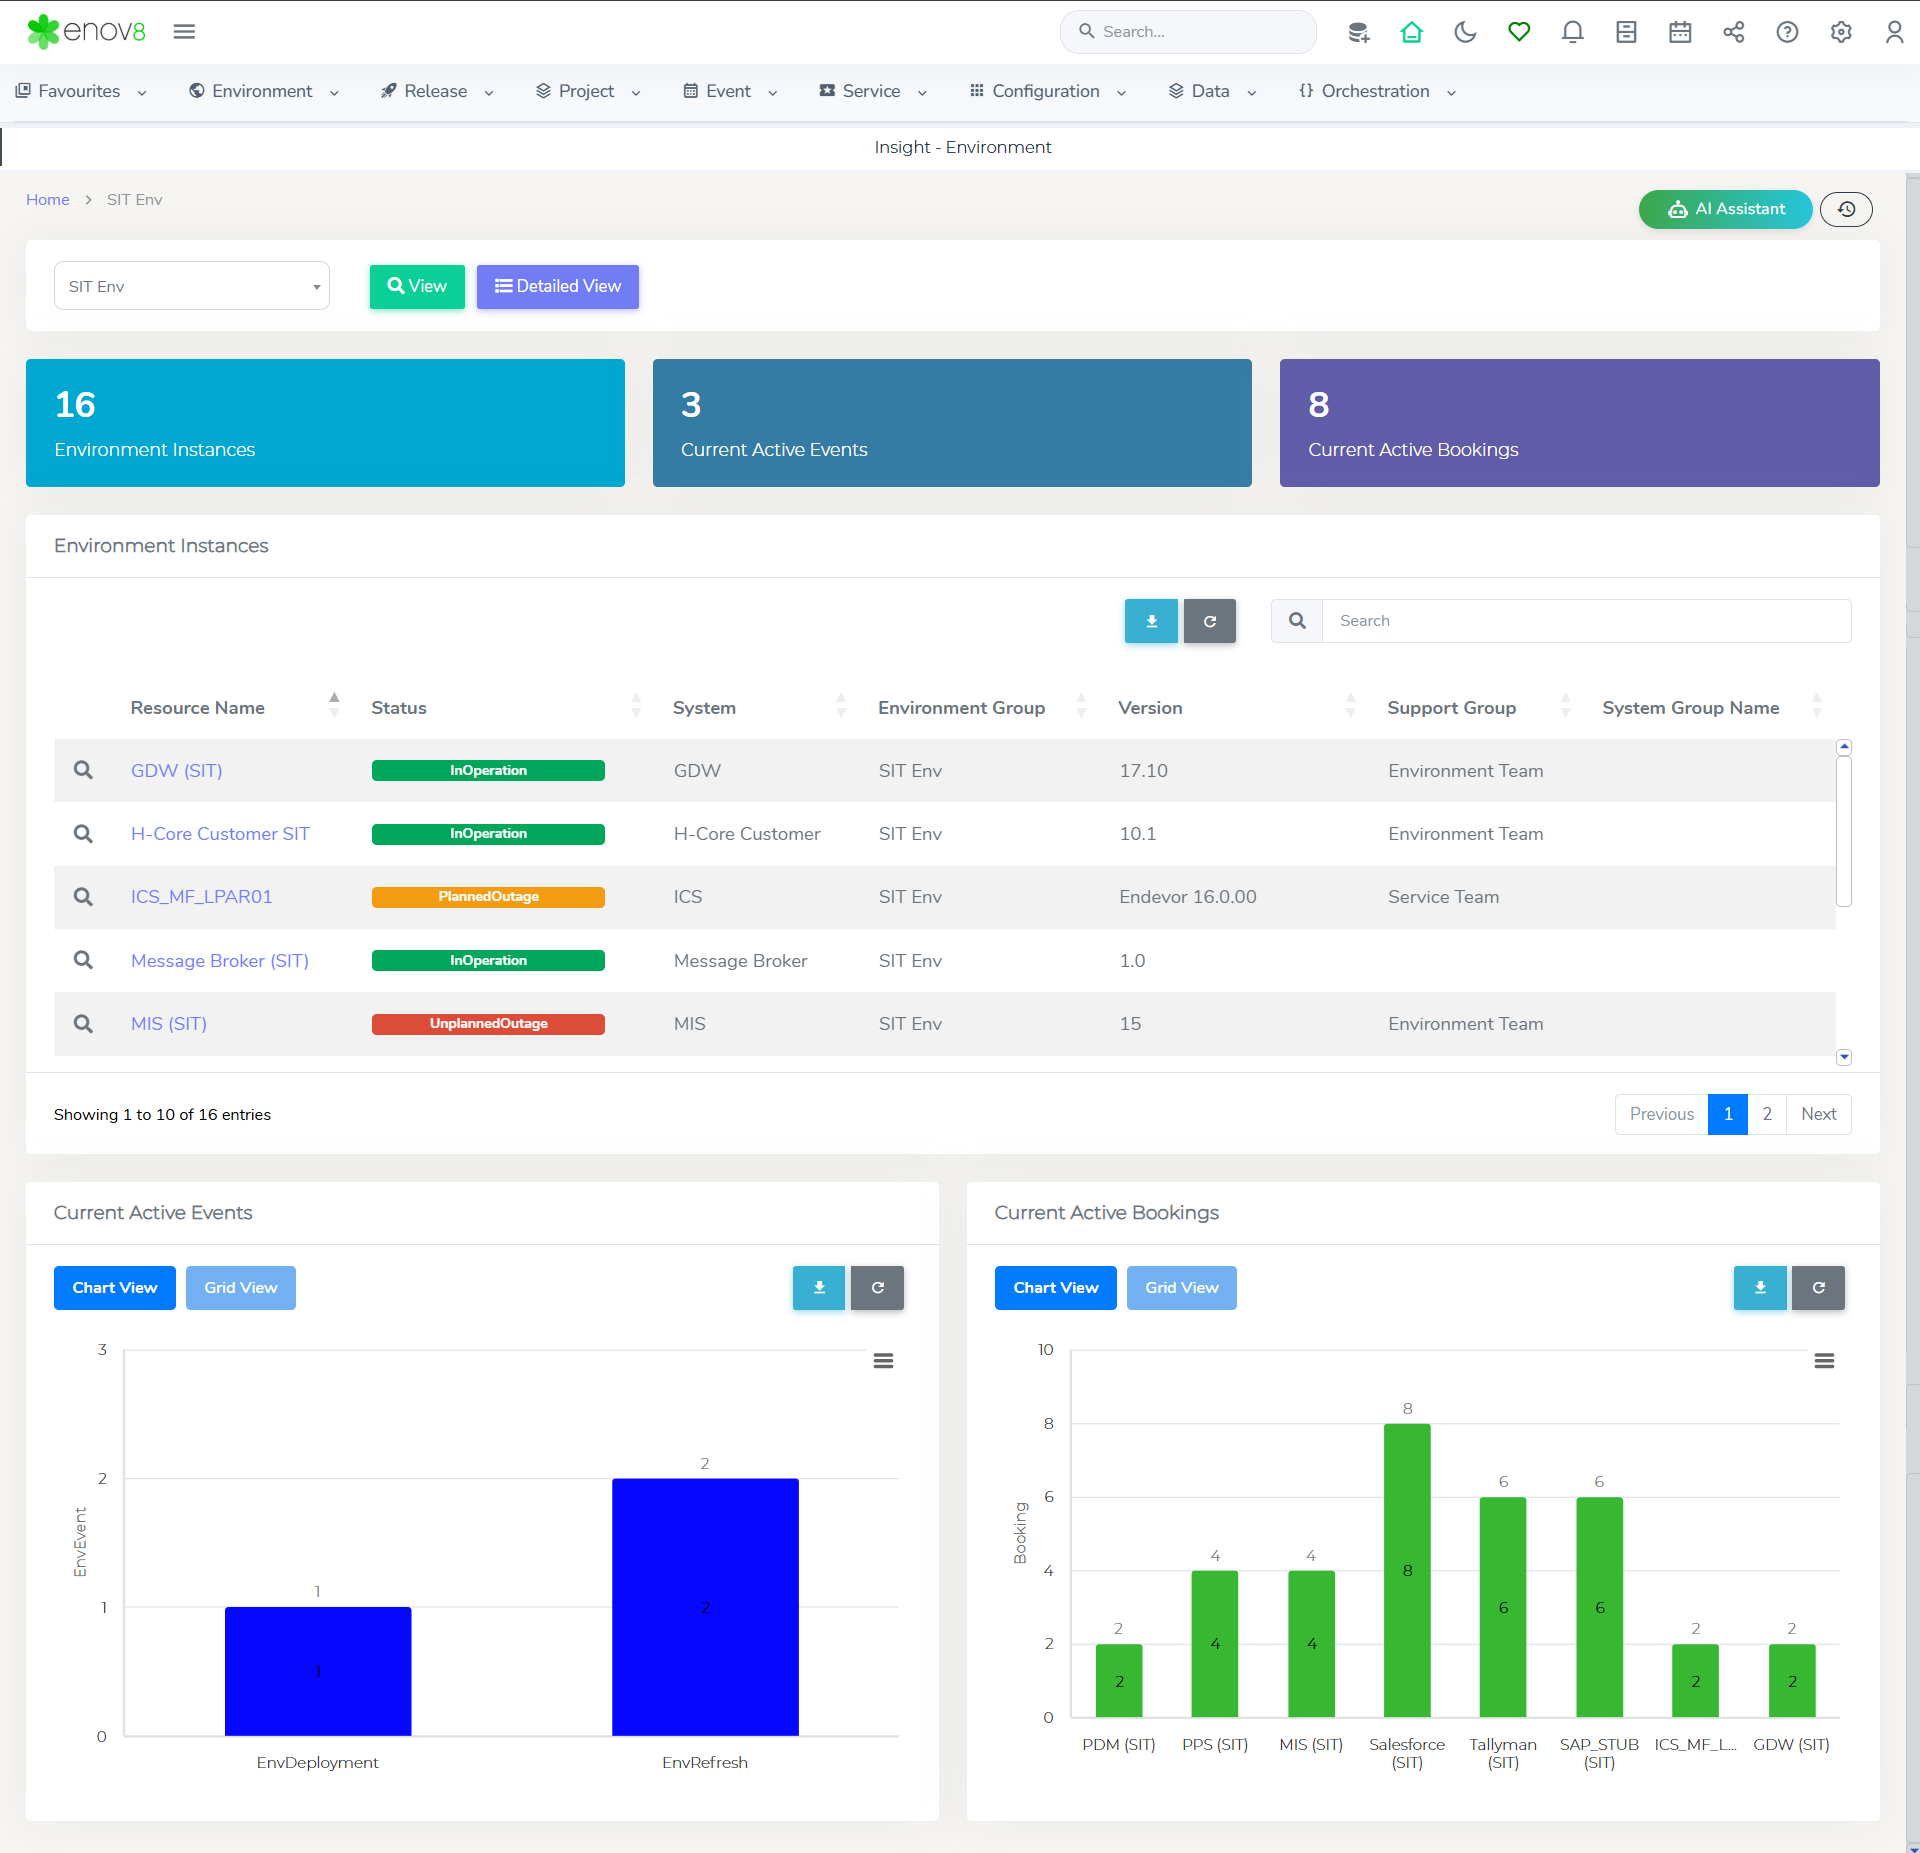
Utilizing the Environment Insights Report
Upon accessing the report, you can choose a specific Environment Group to focus on. This selection customizes the report to showcase data pertinent to the chosen group, enabling targeted analysis.
Features of the Environment Insights Report
The report includes several widgets, each offering distinct and valuable data points:
-
Environment Instances: This widget presents a detailed list of all Environment Instances within the selected group, providing information on their current status and the version deployed, which helps in assessing the health and readiness of each instance.
-
Current Active Events: This section displays active events within the environment group, offering both a visual representation and a tabular breakdown. This dual-view approach aids in quickly understanding the ongoing activities and their implications on the environment.
-
Current Active Bookings: Here, all active bookings related to the environment group are shown. The data is presented in both chart and grid formats, allowing for an easy assessment of resource allocation and usage within the environment.
The Environment Insights report is an essential tool for environment managers and stakeholders, offering a 360-degree view of the environment's operational status, facilitating informed decision-making, and proactive management of resources.
Insights - System
The System Insights report within the Enov8 platform delivers a detailed examination of a chosen system, encompassing various aspects like Environment Instances, microservices, and Infrastructure Components. It also encapsulates data on bookings and events linked to the system's Environment Instances.
Accessing the System Insights Report
To access this insightful report, please follow these steps:
- Navigate to Environment.
- Click on Reports.
- Select Insight - System.
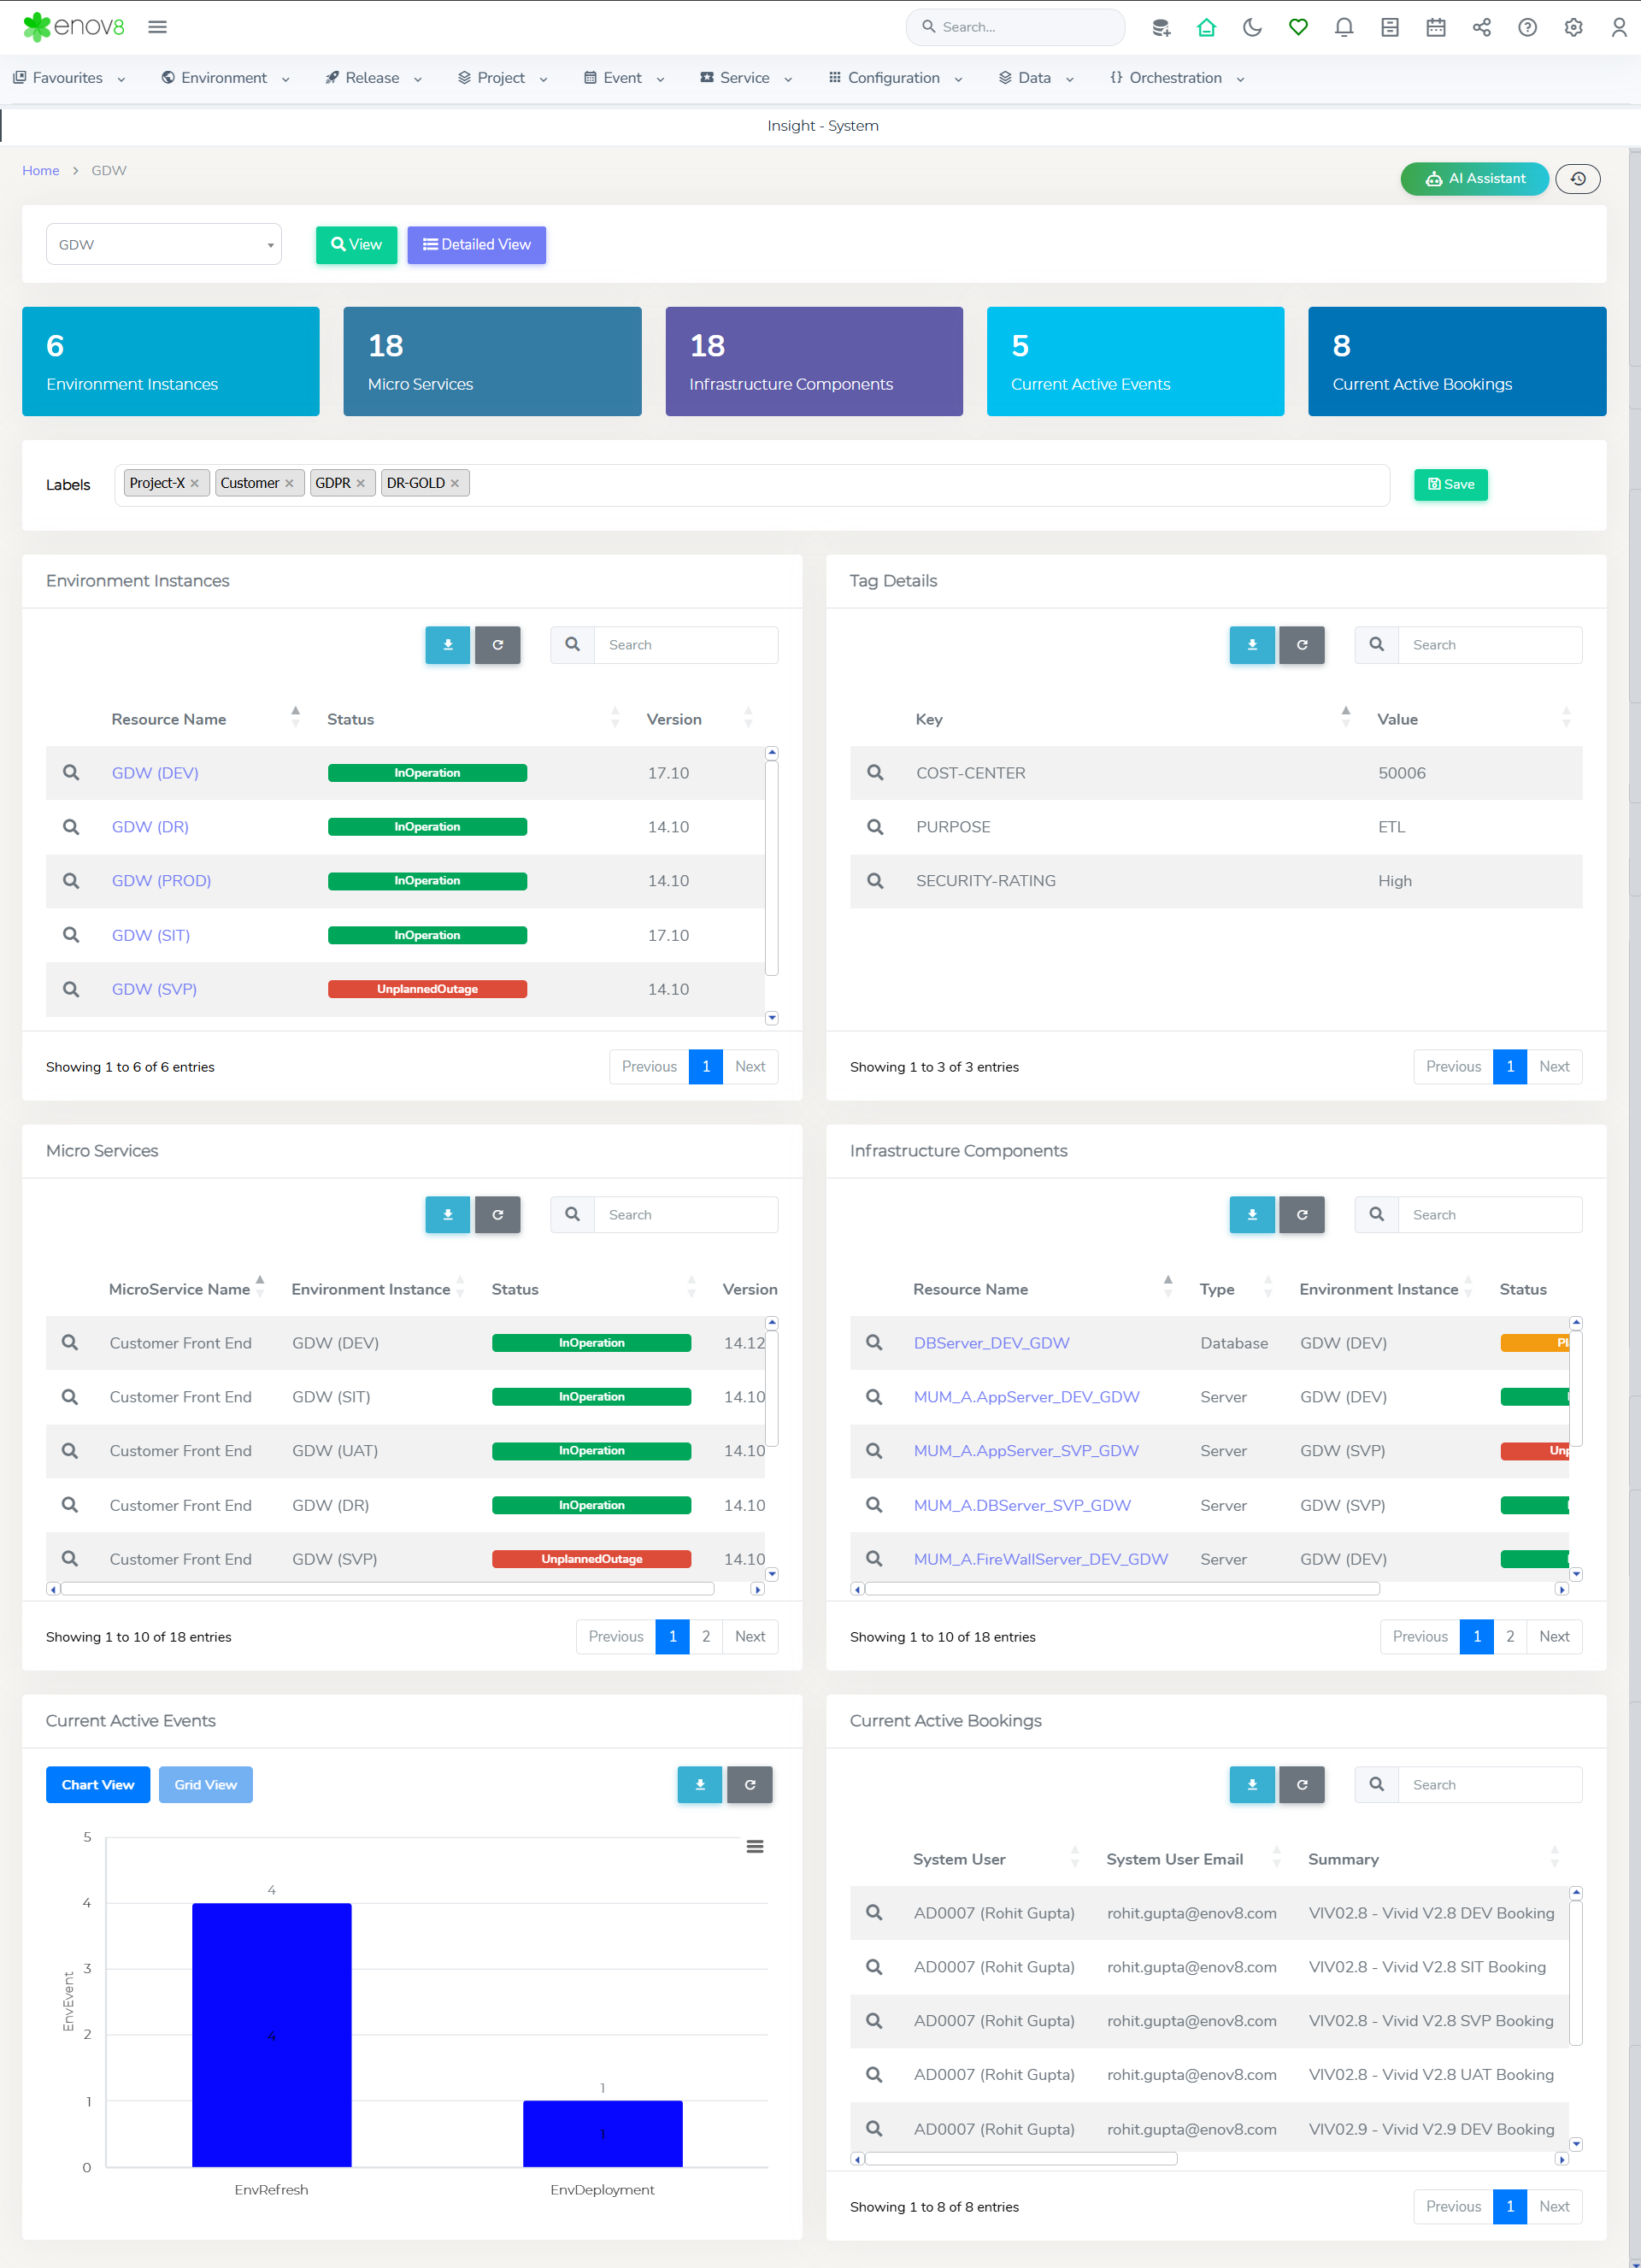
Features of the System Insights Report
This report is structured into several widgets, each offering specific insights:
-
Environment Instances: This widget provides detailed information on all Environment Instances associated with the system, including their current status and the deployed version, aiding in the comprehensive monitoring of the system's operational state.
-
Tag: Displays all the tag key values associated with the system, offering a methodical way to categorize and retrieve system-related information based on defined criteria.
-
Micro Services: Lists all microservices related to the system's Environment Instance, including their status and current version, facilitating an in-depth understanding of the system's architecture and operational health.
-
Infrastructure Component: Details all the Infrastructure Components for the Environment Instance, including their status and version, providing a granular view of the system's infrastructure components.
-
Current Active Events: Offers a combined visual and tabular representation of active events associated with the system, enabling users to quickly grasp ongoing activities and their impact on the system.
-
Current Active Bookings: Shows all current bookings related to the system, presented in a clear format, allowing stakeholders to understand the resource allocation and scheduling for the system.
The System Insights report is a crucial tool for system administrators and IT managers, offering a holistic view of the system's configuration, operational status, and associated activities, thus empowering informed decision-making and proactive management.
Insights - Instance
The Instance Insights report within the Enov8 platform offers comprehensive visibility into a selected Environment Instance, detailing the health and versioning of Infrastructure Components, alongside change history.
Accessing the Instance Insights Report
To access this report, follow these steps:
- Navigate to Environment.
- Click on Reports.
- Select Insight-Instance.
Once there, you can filter the report by choosing the specific Environment Instance you wish to analyze.
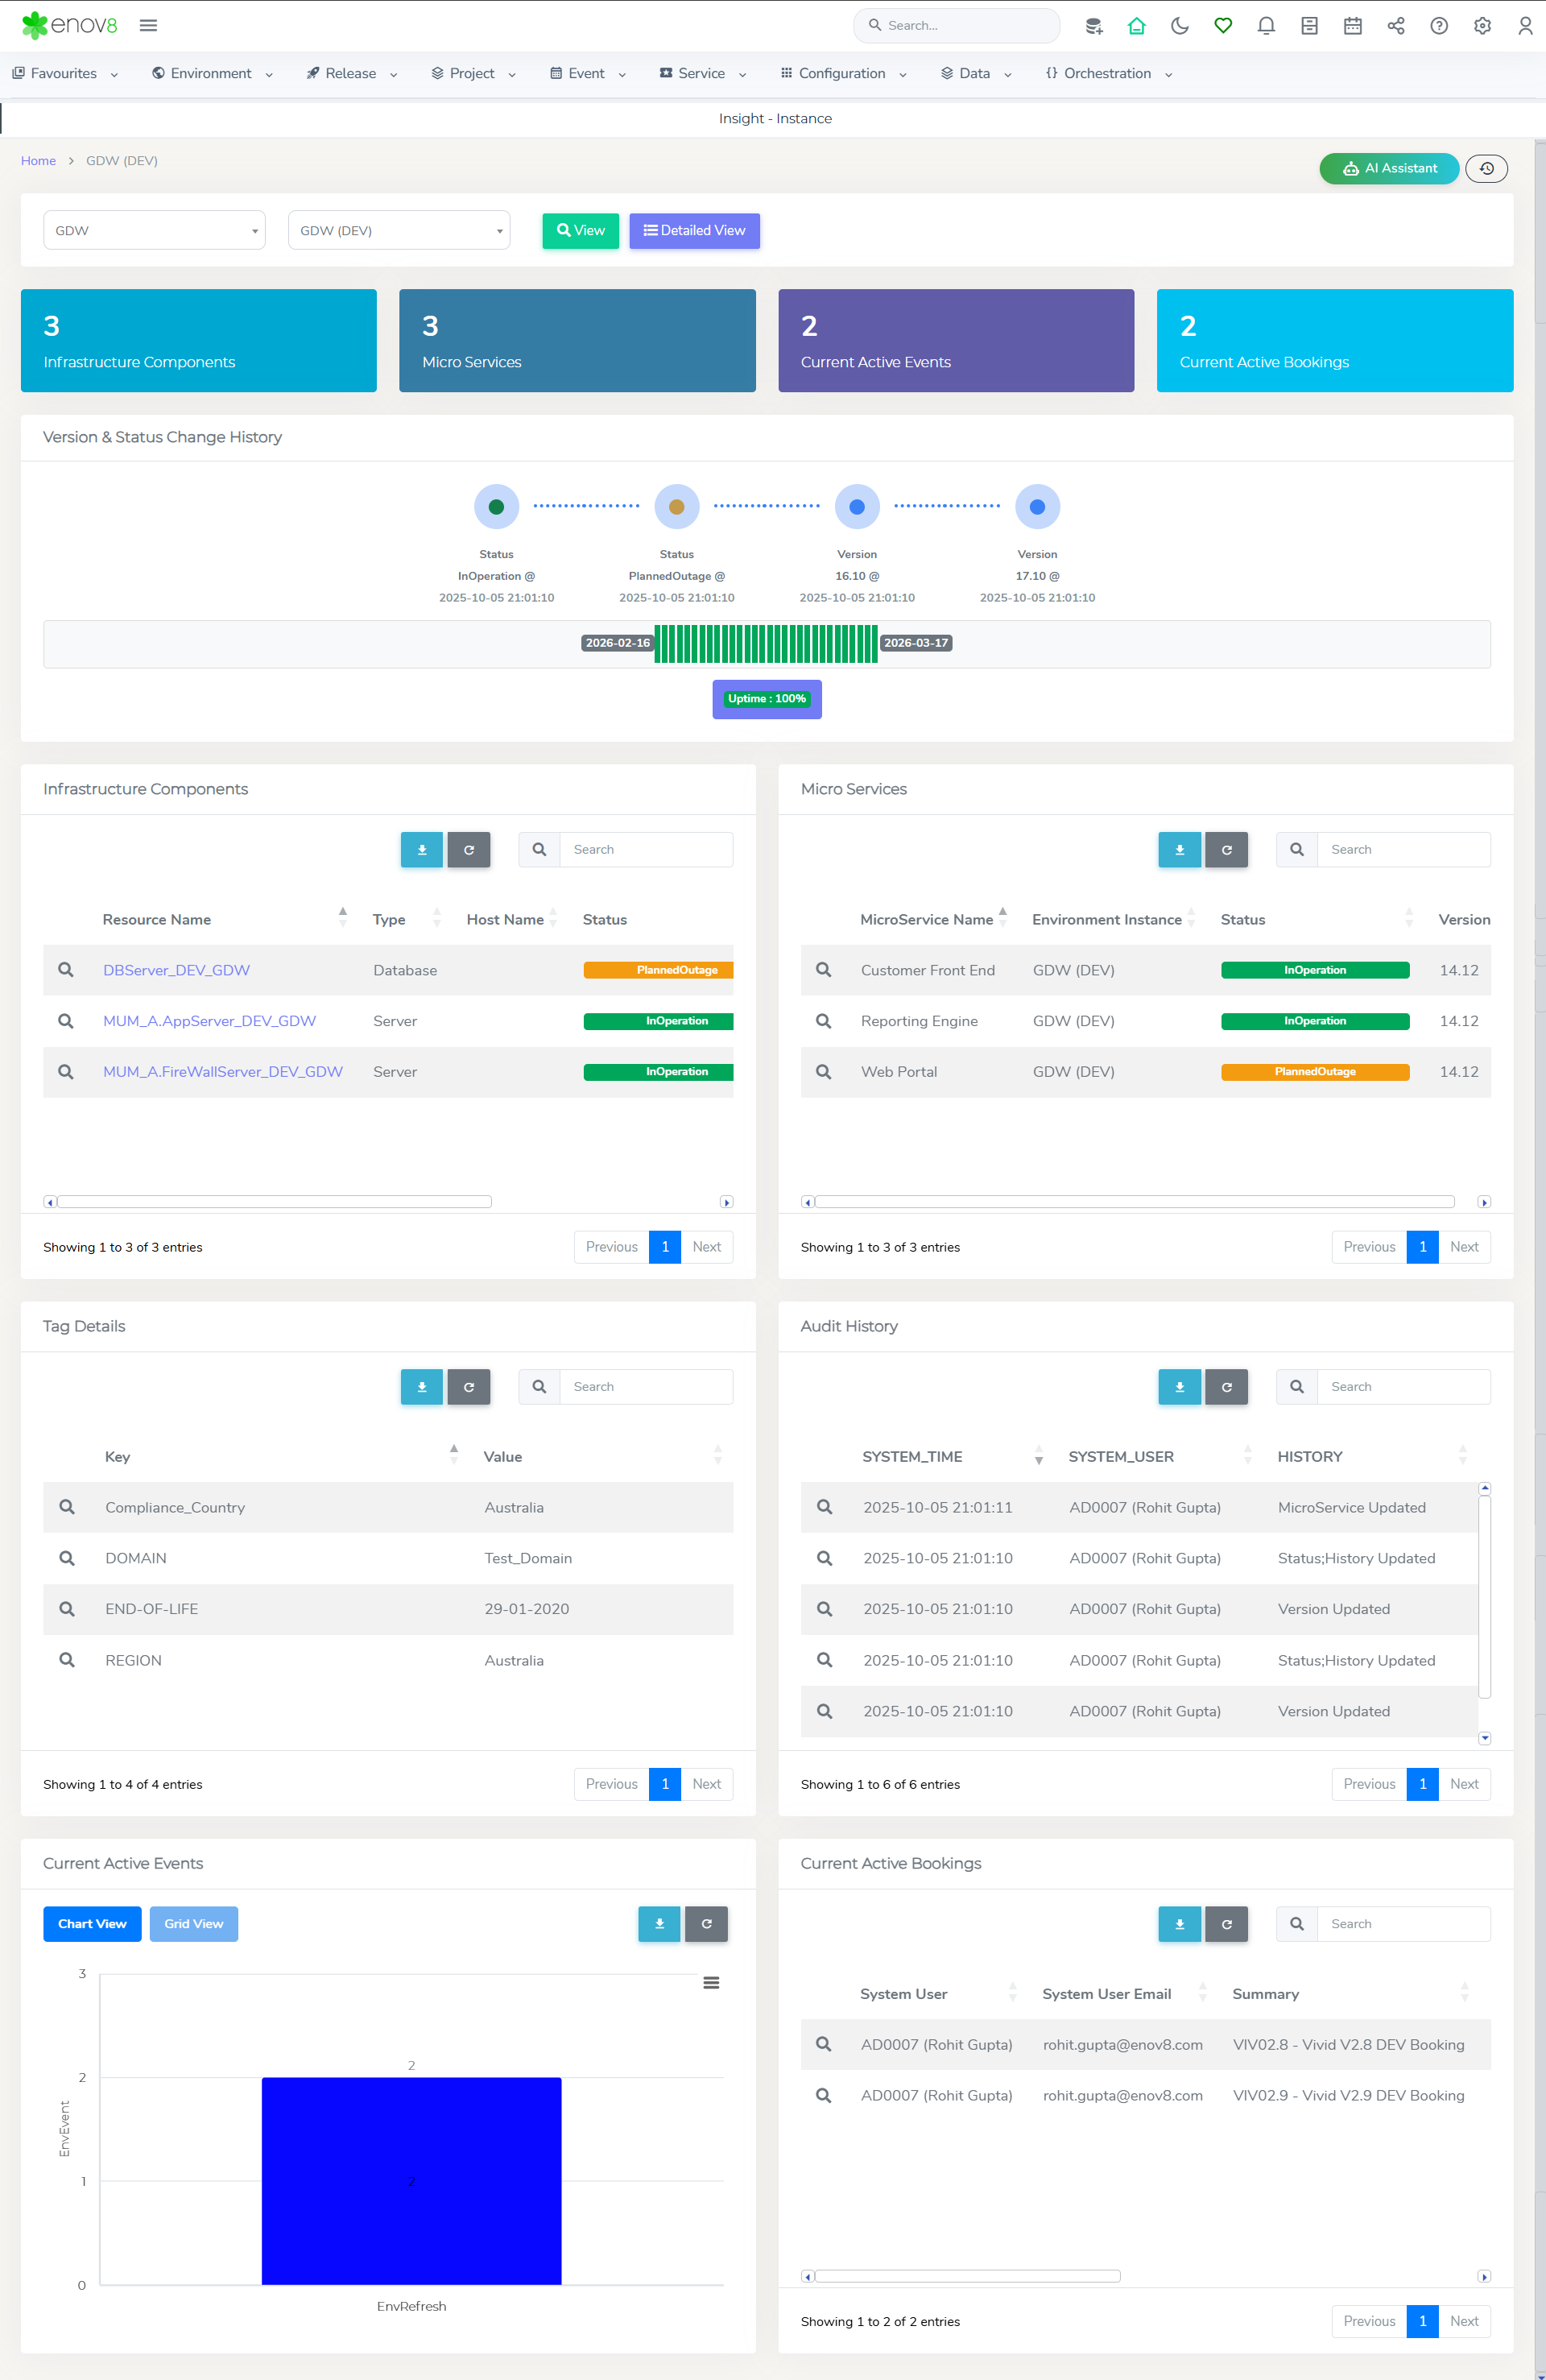
Features of the Instance Insights Report
The report is structured into various widgets, each providing detailed data:
| Feature | Description |
|---|---|
| Total Widgets | Displays counts for various elements within the Environment Instance: |
| - Infrastructure Components | Shows the number of Infrastructure Components in the selected instance. |
| - Micro Services | Indicates the total microservices within the instance. |
| - Current Active Events | Counts the active events associated with the instance. |
| - Current Active Bookings | Enumerates the active bookings for the instance. |
| Version & Status Change History | Offers a graphical representation of the instance's version and status changes over time, including a three-month availability trend. |
| Infrastructure Components | Lists all Infrastructure Components of the selected instance, detailing their statuses and versions. |
| Tag Details | Enumerates all tag key values linked to the instance. |
| Micro Service | Catalogs the microservices within the instance, including their statuses and versions. |
| Audit History | Chronicles the modifications made to the instance, providing a transparent change log. |
| Current Active Events | Outlines active environment events in both chart and grid formats. |
| Current Active Bookings | Details the ongoing bookings for the Environment Instance. |
This report serves as a pivotal tool for environment managers and IT professionals, offering a granular view of an Environment Instance's operational and historical context, facilitating informed decision-making and effective management.
Insights - Component
The Component Insights report in the Enov8 platform provides a detailed overview of a selected Infrastructure Component within an Environment Instance, offering insights into the component's health, version, and change history.
Accessing the Component Insights Report
To view this report, follow these steps:
- Navigate to Environment.
- Click on Reports.
- Select Insight-Component.
You can refine the report's focus by selecting the specific Infrastructure Component you're interested in.
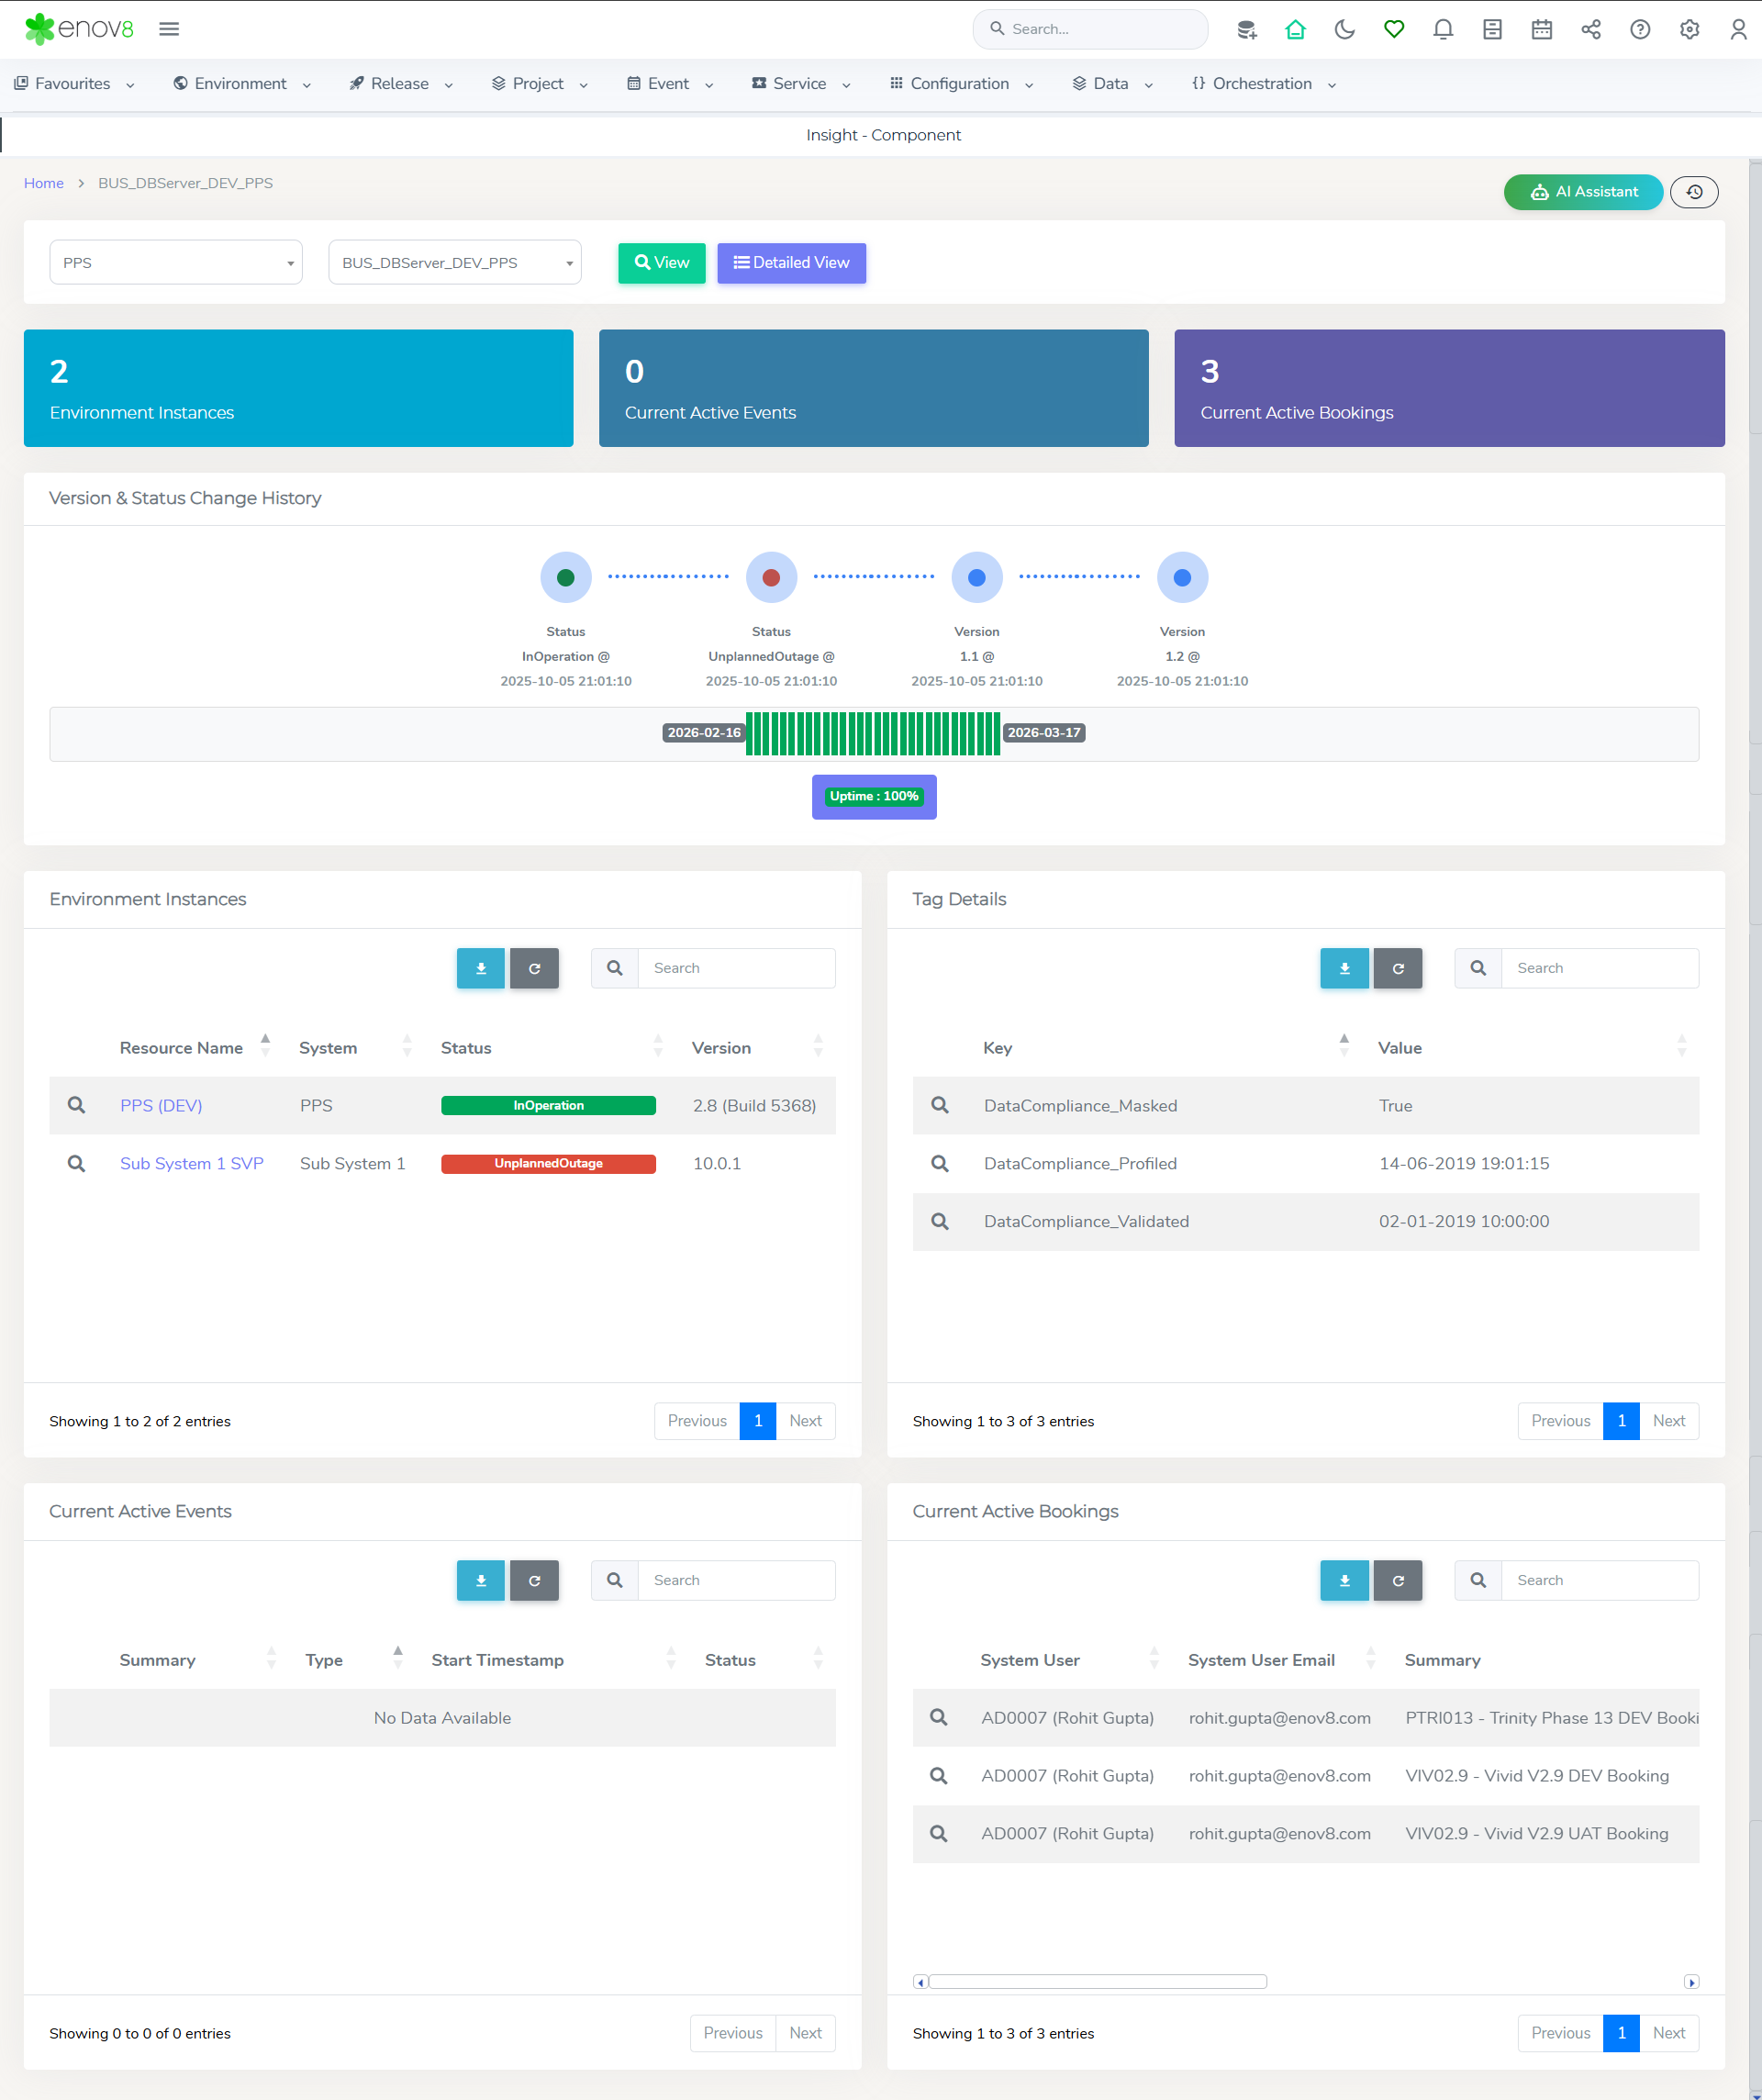
Features of the Component Insights Report
The report is organized into several widgets, each offering distinct insights:
-
Total Widgets: Provides aggregate information about the selected component:
- Environment Instances: Shows the total number of Environment Instances associated with the component.
- Current Active Events: Indicates the total active events related to the component.
- Current Active Bookings: Lists the total active bookings for the component.
-
Version & Status Change History: Displays a graphical representation of the component's version and status changes over time, along with an availability trend for the past three months.
-
Environment Instances: Details all the Environment Instances linked to the selected component, offering a comprehensive overview.
-
Tag Details: Enumerates all tag key values associated with the component, providing additional contextual information.
-
Current Active Events: Lists all active events related to the component, aiding in monitoring ongoing activities.
-
Current Active Bookings: Shows all active bookings for the component, essential for resource allocation and planning.
This report is invaluable for IT professionals and environment managers who need to monitor and assess the status and history of specific Infrastructure Components within their IT environment, enabling proactive management and informed decision-making.
Analytics
In this section we’ll go through different type of analytic reports
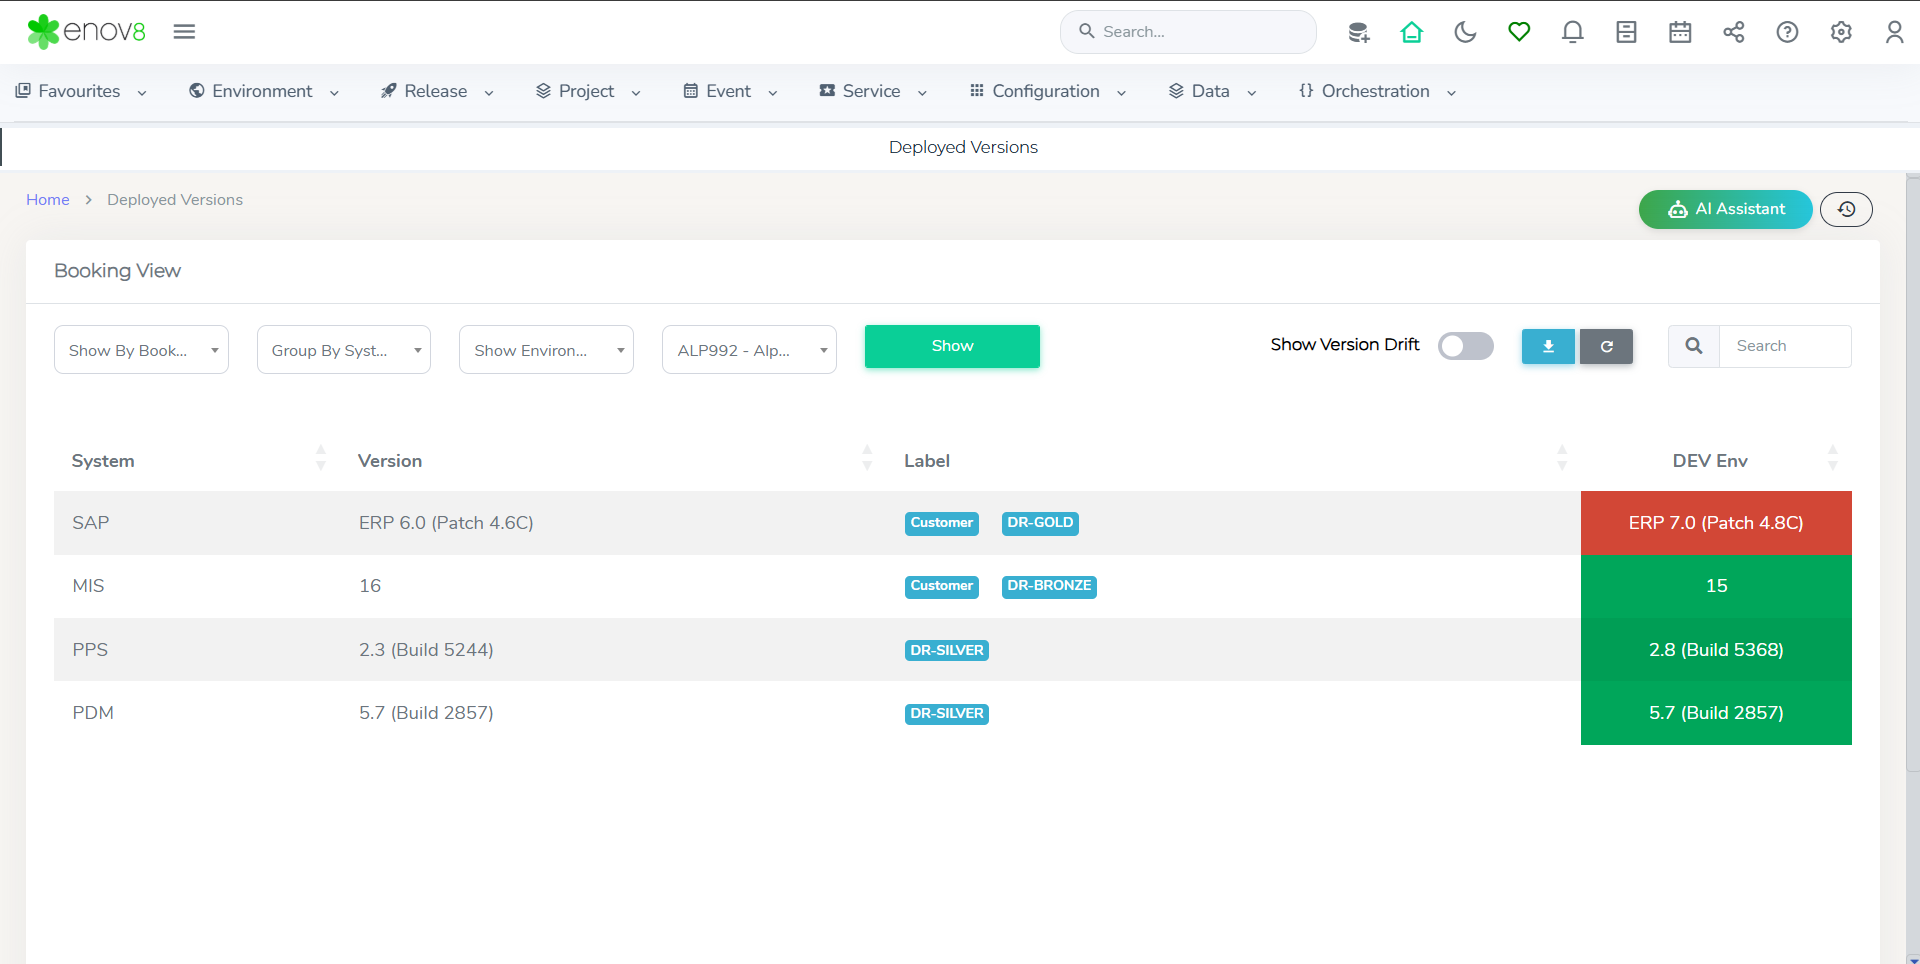
Deployed Versions
The Deployed Versions report in the Enov8 platform offers a heatmap style visualization that illustrates the latest build versions available for Environment Instances, juxtaposed with the versions deployed across different environment types, all underpinned by the current health status of each instance.
Accessing the Deployed Versions Report
To view this report, follow these steps:
- Navigate to Environment.
- Click on Analytics.
- Select Deployed Versions.
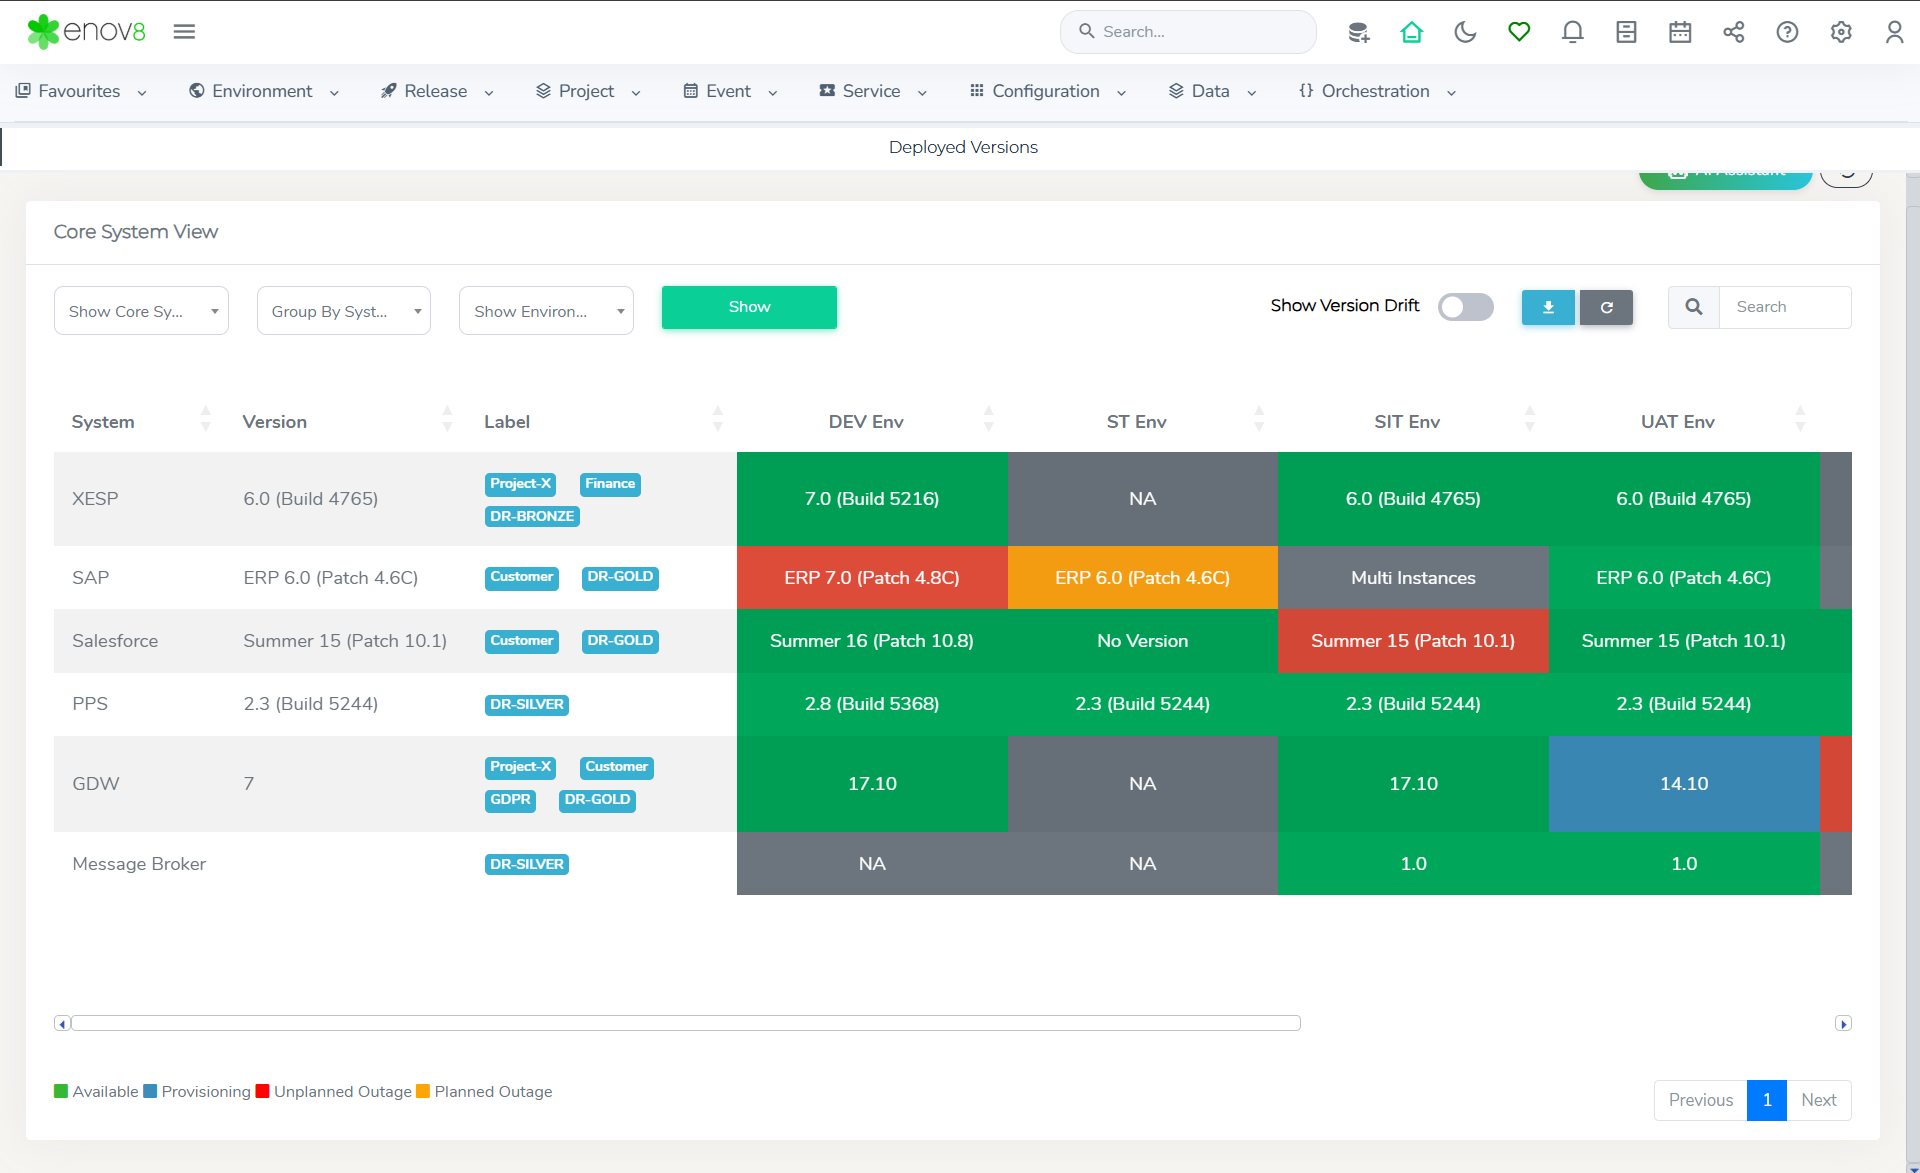
Features of the Deployed Versions Report
-
Heatmap Visualization: This report uses a heatmap to present the latest available and deployed build versions across environment instances, offering an intuitive way to assess deployment status and version consistency.
-
Health Overlay: The current health status of each environment instance is integrated into the heatmap, providing immediate visibility into the operational status of each environment.
-
Default View: Initially, the report displays core system details across different environments, giving a broad overview of the deployment landscape.
Filtering Options:
-
Show by Business Unit: This filter allows you to view data segmented by systems within a specific business unit, enhancing focus and relevance.
-
View by Bookings: Enables the examination of environment instances associated with particular bookings, aiding in resource and deployment tracking.
-
Customization Options: The report allows for various customizations, including:
- Changing column headers to display information by environment group or type.
- Grouping data by system through a dropdown selection.
-
Detailed Component Information: The report provides options to delve into Infrastructure Component Version Details and Micro Service information for each Environment Instance, ensuring a detailed understanding of the environment's configuration.
This comprehensive report is a valuable tool for teams to monitor deployment statuses, version consistency, and system health, facilitating informed decision-making and efficient Environment.
Environment Drift
Environment drift is a common challenge in IT that occurs when different environments—like development, testing, and production—become inconsistent over time. This can happen due to changes or updates that are applied to one environment but not others, resulting in unexpected issues.
Managing environments without a clear strategy can lead to issues such as bugs that appear in production but not in testing, deployment failures, or even security vulnerabilities. Environment drift complicates your workflows and can create inefficiencies and delays.
Environment Drift report in Enov8 allows users to visualise and compare environment instances to quickly identify differences among different instances of a System, highlighting disparities that could indicate configuration drift or versioning inconsistencies.and take action.
Accessing the Environment Drift Report
To access this report, please follow these steps:
- Navigate to Environment.
- Click on Analytics.
- Select Environment Drift.
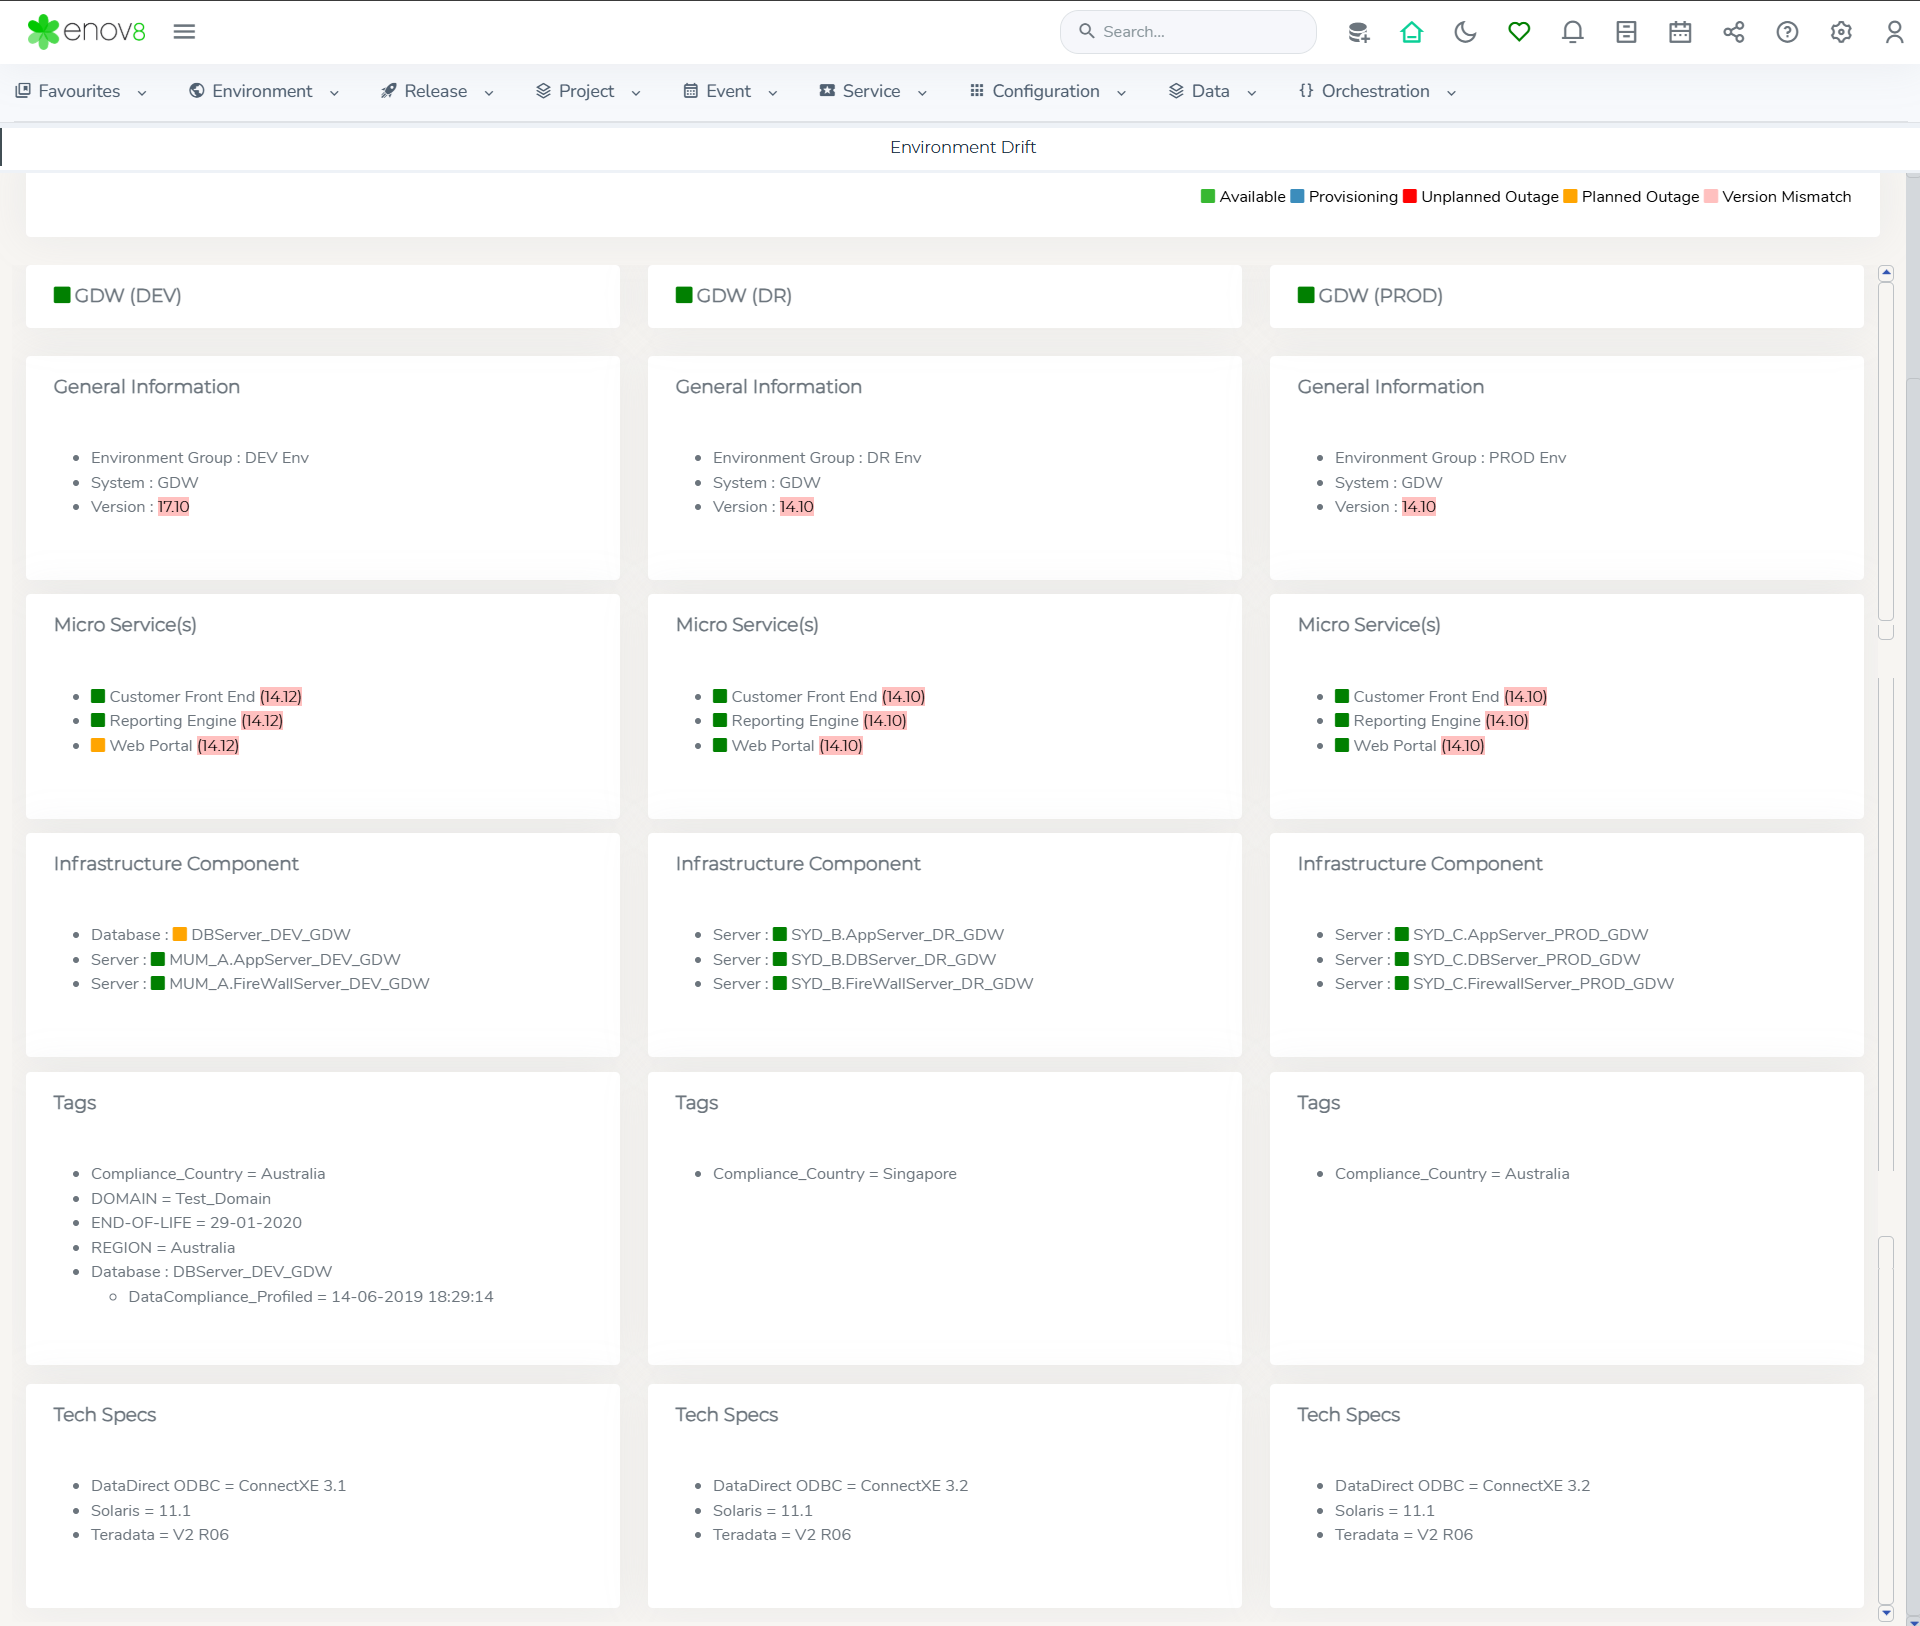
Utilizing the Environment Drift Report
-
System Selection: Initially, you'll select the System you want to investigate, which narrows down the focus of the report to relevant Environment Instances associated with that particular system.
-
Instance Comparison: After selecting the System, choose the specific Environment Instances you wish to compare. This step is crucial for identifying any discrepancies between the instances.
-
Highlighting Differences: The report illuminates differences in version information for Environment Instances and associated Micro Services. If there are any disparities in the versions of the displayed objects, they will be prominently highlighted.
-
Detailed Insights: By pinpointing the exact differences between the Environment Instances, the report provides detailed insights that can help in diagnosing issues related to configuration drift, ensuring consistency across environments, and aiding in troubleshooting and compliance efforts.
The Environment Drift report is a vital tool for IT professionals, particularly those involved in Environment, DevOps, and IT operations, offering a clear and actionable visualization of the state of Environment Instances and helping maintain system integrity and consistency.
Environment Cost
Environment cost refers to the expenses incurred in creating, maintaining, and managing environments used for development, testing, and staging purposes. These costs include infrastructure, licensing, and operational overheads. While test environments are essential for ensuring software quality, unchecked growth or inefficiencies can cause costs to balloon unnecessarily, leading to resource wastage and delays in project delivery.
Challenges of Unmanaged Test Environments
-
Rising Costs: Redundant or underutilised test environments can significantly increase infrastructure and licensing costs.
-
Operational Complexity: Excessive environments make it harder to manage configurations, leading to inefficiencies and errors.
-
Idle Resources: Environments that are rarely used consume valuable resources that could support other critical business functions.
-
Lack of Visibility: Without proper tracking, it becomes challenging to identify and address cost inefficiencies.
Key Features of the Environment Cost Dashboard
-
Baseline Analysis: Identify the minimum number of environments required to meet business needs effectively.
-
Cost Tracking: Continuously monitor environment usage and associated costs to detect anomalies or inefficiencies.
-
Consolidation Strategies: Remove or merge redundant environments to streamline operations and cut costs.
-
Governance Policies: Enforce approval processes and tracking mechanisms to ensure new environments are provisioned only when necessary.
Cost Unit Configuration: Users can modify the base cost units via the Cost Management module located at Configuration >> System Administration.
Accessing the Environment Cost Dashboard
To view this dashboard, follow these steps:
- Navigate to Environment.
- Click on Analytics.
- Select Environment Cost.
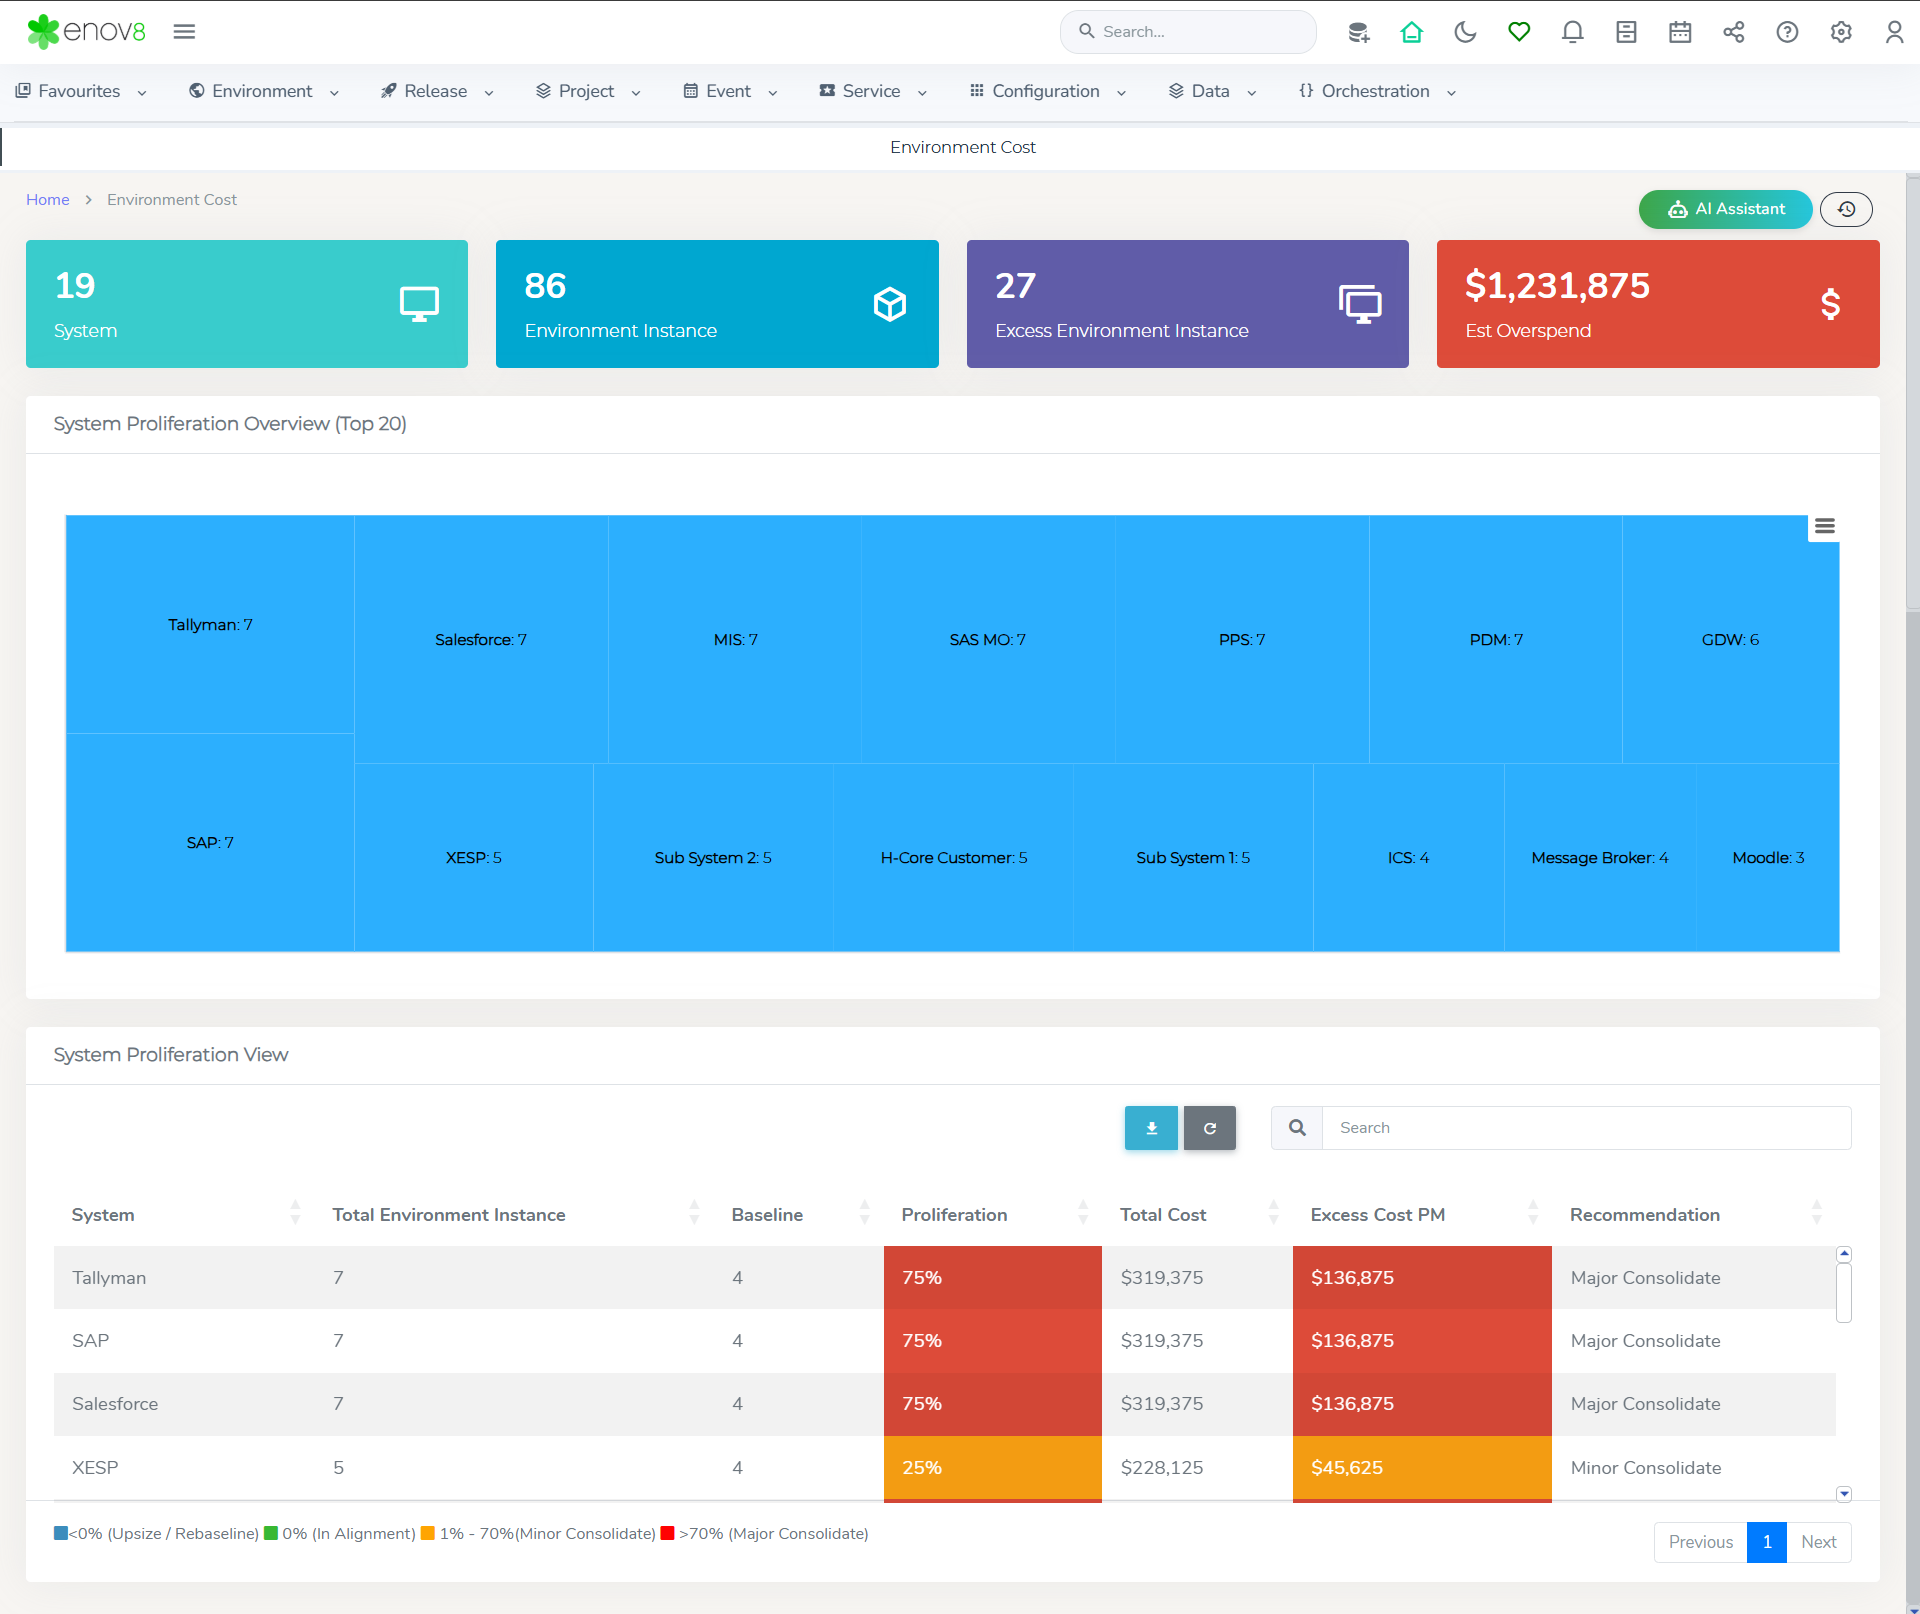
The dashboard is organized into two main sections:
-
System Proliferation Overview: Highlights heavily proliferated systems that require prioritized attention, helping identify systems that consume excessive resources.
-
System Proliferation Detailed View: Provides a detailed breakdown of systems, their total environment instances, and their baseline comparison.
- The Proliferation Column: Highlights the percentage of excess proliferation (e.g., a system with a 75% proliferation rate exceeds the baseline by a significant margin).
- Cost Breakdown: Shows the total financial cost, excess costs due to proliferation, and actionable recommendations such as "Major or Minor Consolidation" based on urgency.
System-Specific Settings
For tailoring cost metrics to individual systems, attributes like Proliferation_Baseline_Instance_Number and Proliferation_Baseline_Instance_Cost can be added to the System Object, allowing for customized cost tracking and analysis.
Environment Availability
The Environment Availability Dashboard provides a detailed, real-time view of system and environment uptime, helping teams monitor availability, identify outages, and assess business impact across selected environments and systems. This dashboard is designed for IT operations teams, environment managers, and release coordinators who need to:
- Track uptime across non-production and production environments.
- Monitor system-level availability (e.g., SAP, Tallyman, GDW).
- Quickly identify and respond to unplanned outages.
- Assess business impact and support incident root-cause analysis
This report can be accessed via Environment > Analytics > Environment Availability.
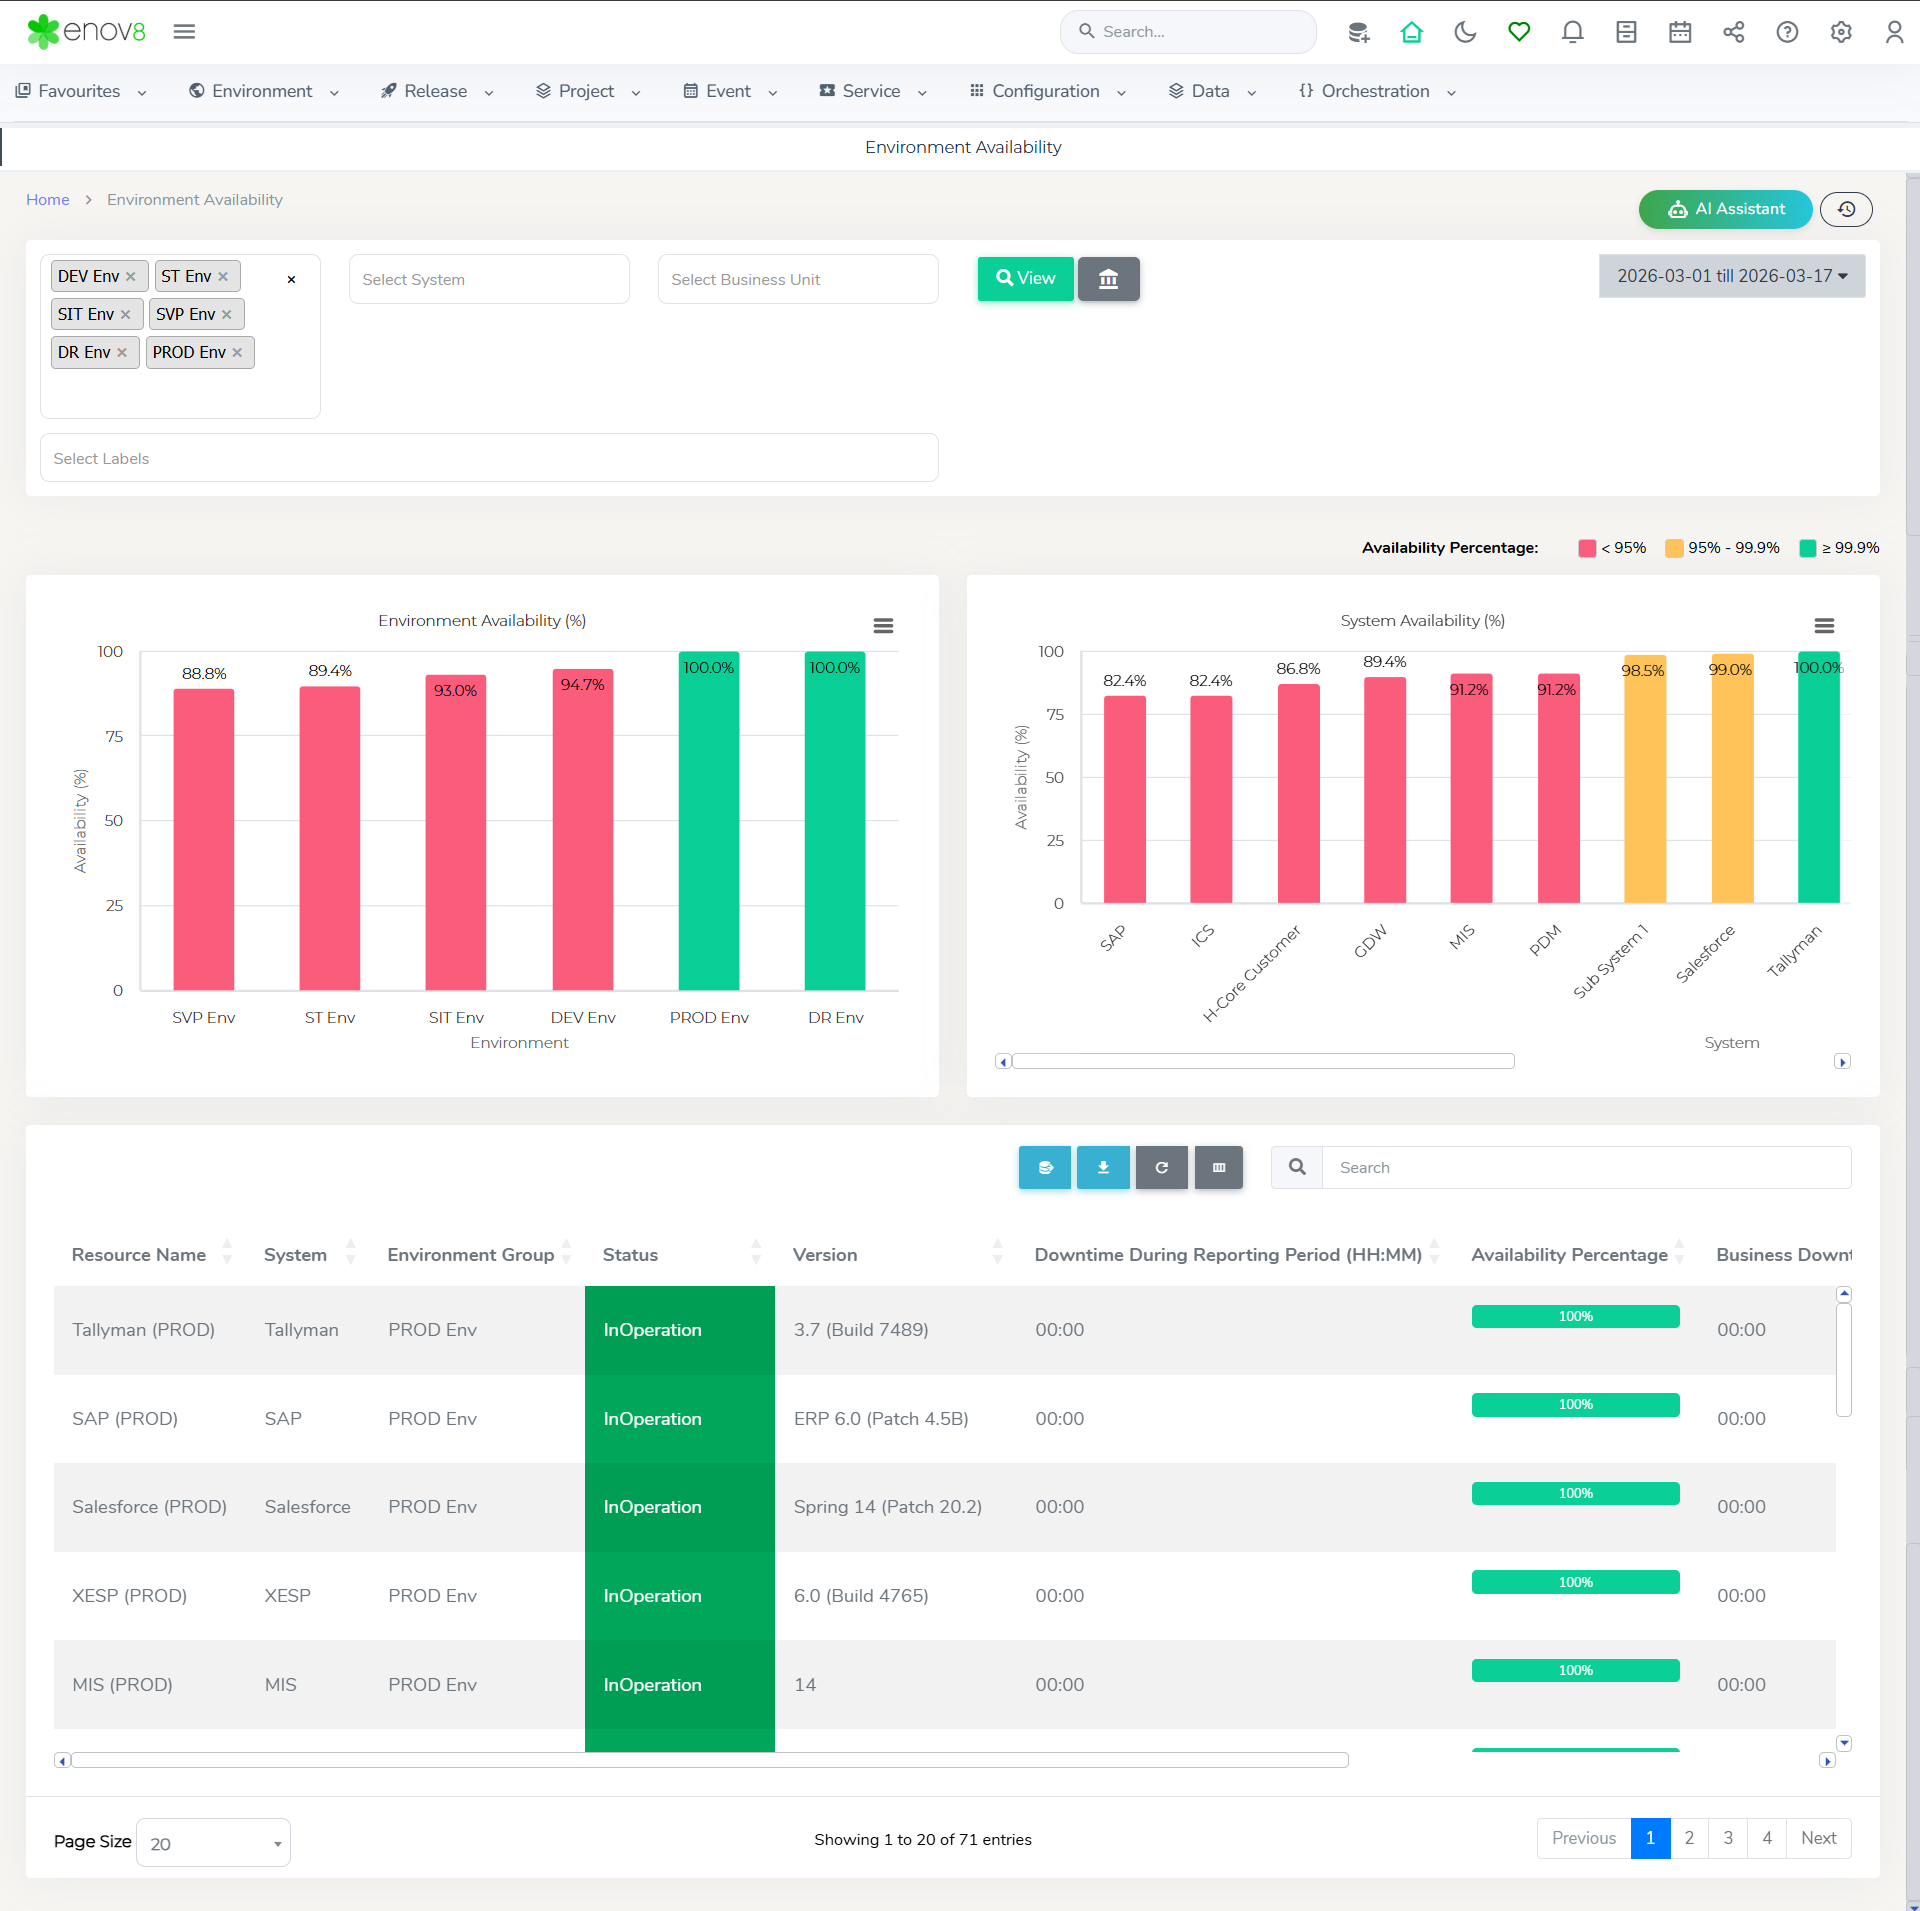
Key sections of the Environment Availability Report
1.Environment Availability (%)
- Displays bar charts showing the availability percentage for each environment group (e.g., DEV, SIT, UAT, PROD).
- Colour-coded to visually highlight environments with lower availability.
- Helps users quickly pinpoint environments that require attention.
2.System Availability (%)
- Aggregated view of system-level availability across all selected environments
- Allows comparison between different systems (e.g., SAP vs Tallyman).
3.Detailed Status Table
Includes the following columns for each resource:
| Column | Description |
|---|---|
| Resource Name | Instance Name (e.g., Tallyman (PROD)) |
| System | System associated with the environment. |
| Environment Group | Logical grouping (DEV, UAT, PROD, etc.) |
| Status | Current state (e.g., InOperation, UnplannedOutage). |
| Version | Version or patch details of the system. |
| Downtime During Reporting Period | Duration (HH:MM) of any outages during the selected timeframe. |
| Availability Percentage | Calculated uptime percentage (visually shown with progress bar). |
| Business Downtime | Downtime impacting business operations. |
| Business Availability Percentage | Calculated uptime percentage considering only business days (Monday to Friday). |
Tag Matrix
The Tag Matrix report in the Enov8 platform presents a grid-style visualization that displays the values associated with selected tag(s) for a specific System, Environment Group, Environment Instance, or Infrastructure Component. This report is instrumental in analyzing and understanding the tagged data points across your IT environment.
This report can be accessed via Environment > Analytics > Tag Matrix.
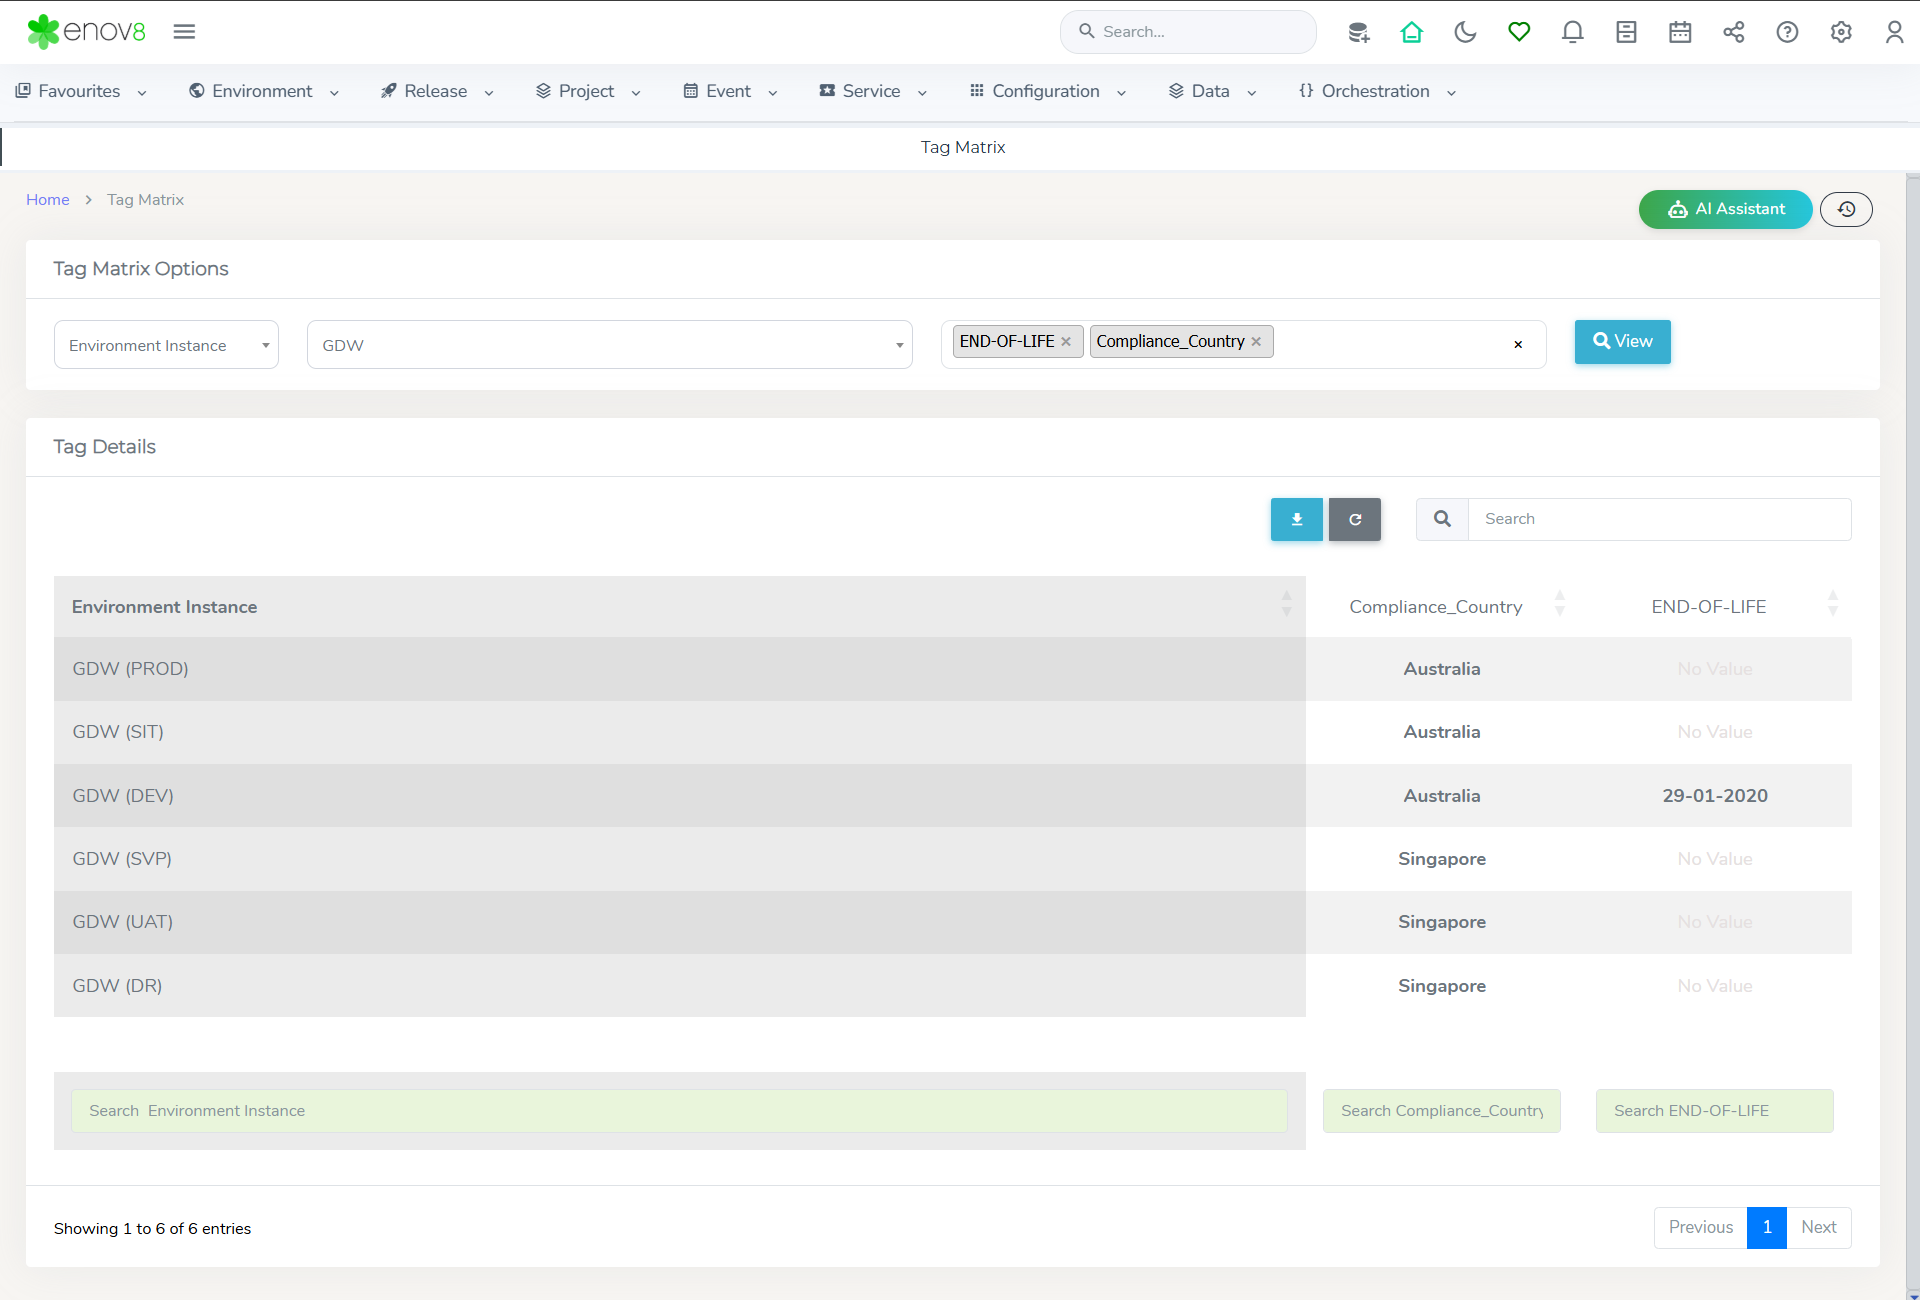
Features of the Tag Matrix Report
-
Grid Style Visualization: The report showcases a matrix where each cell represents the value of a selected tag for a particular System, Environment Group, Environment Instance, or Infrastructure Component, facilitating an at-a-glance understanding of tag distributions and values.
-
Selectable Tags: Users can choose one or more tags to be displayed in the report, allowing for a focused and customizable analysis based on relevant tag criteria.
-
Filtering Options: The report provides the ability to filter the data by System, Environment Group, Environment Instance, or Infrastructure Component, offering a tailored view that aligns with the user's specific area of interest or analysis needs.
-
Comprehensive Data Overview: By correlating systems, environments, and components with their respective tags, the report offers a comprehensive perspective, aiding in data classification, compliance tracking, and resource management.
This Tag Matrix report is a valuable tool for IT and environment managers, enabling them to efficiently monitor and analyze tagged attributes within their IT landscape, thereby supporting better data governance, resource allocation, and insight generation.
VCMDB
In this section we’ll go through the visual CMDB Reports.
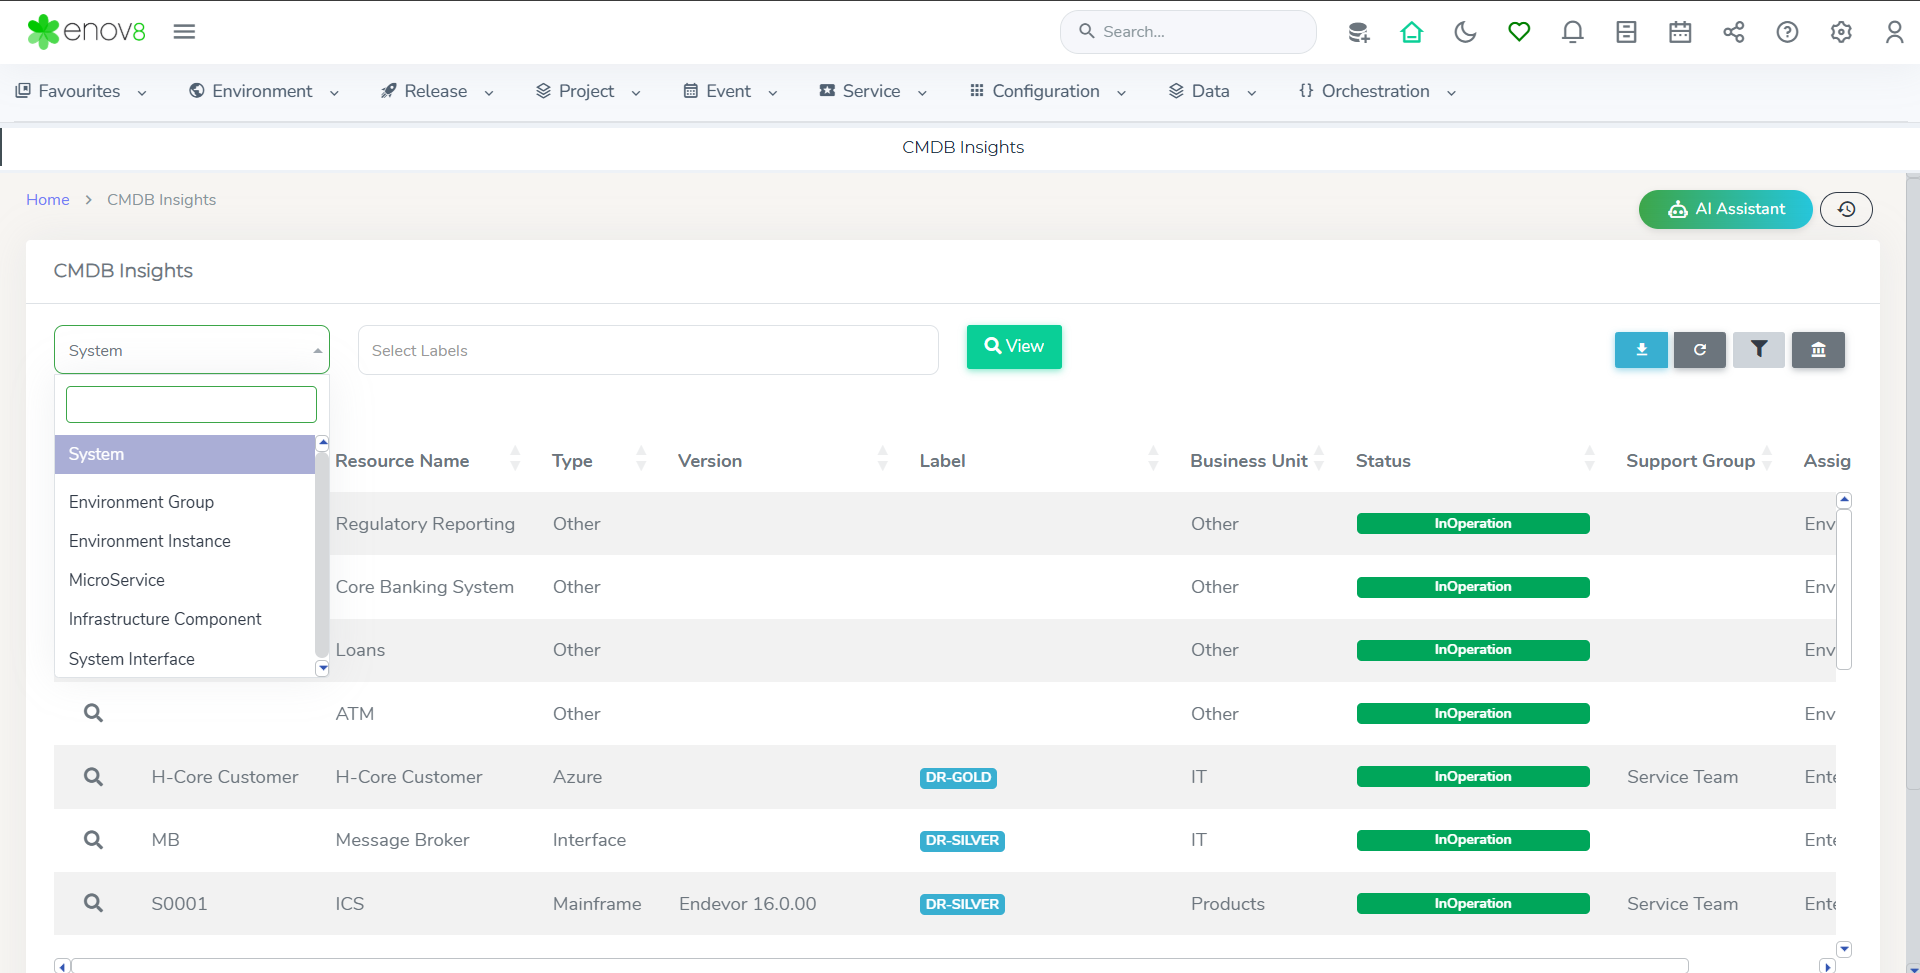
CMDB Insights
To View, navigate to Environment > VCMDB > CMDB Insights
Environment Connectivity
The dashboard designed to visualize environment connectivity offers a multifaceted perspective on how different Environment Instances and Infrastructure Components interact within your organization. It provides various views tailored to different aspects of your IT landscape.
Accessing the Environment Connectivity Dashboard
To access this dashboard, follow these steps:
- Navigate to Environment.
- Click on VCMDB.
- Select Environment Connectivity.
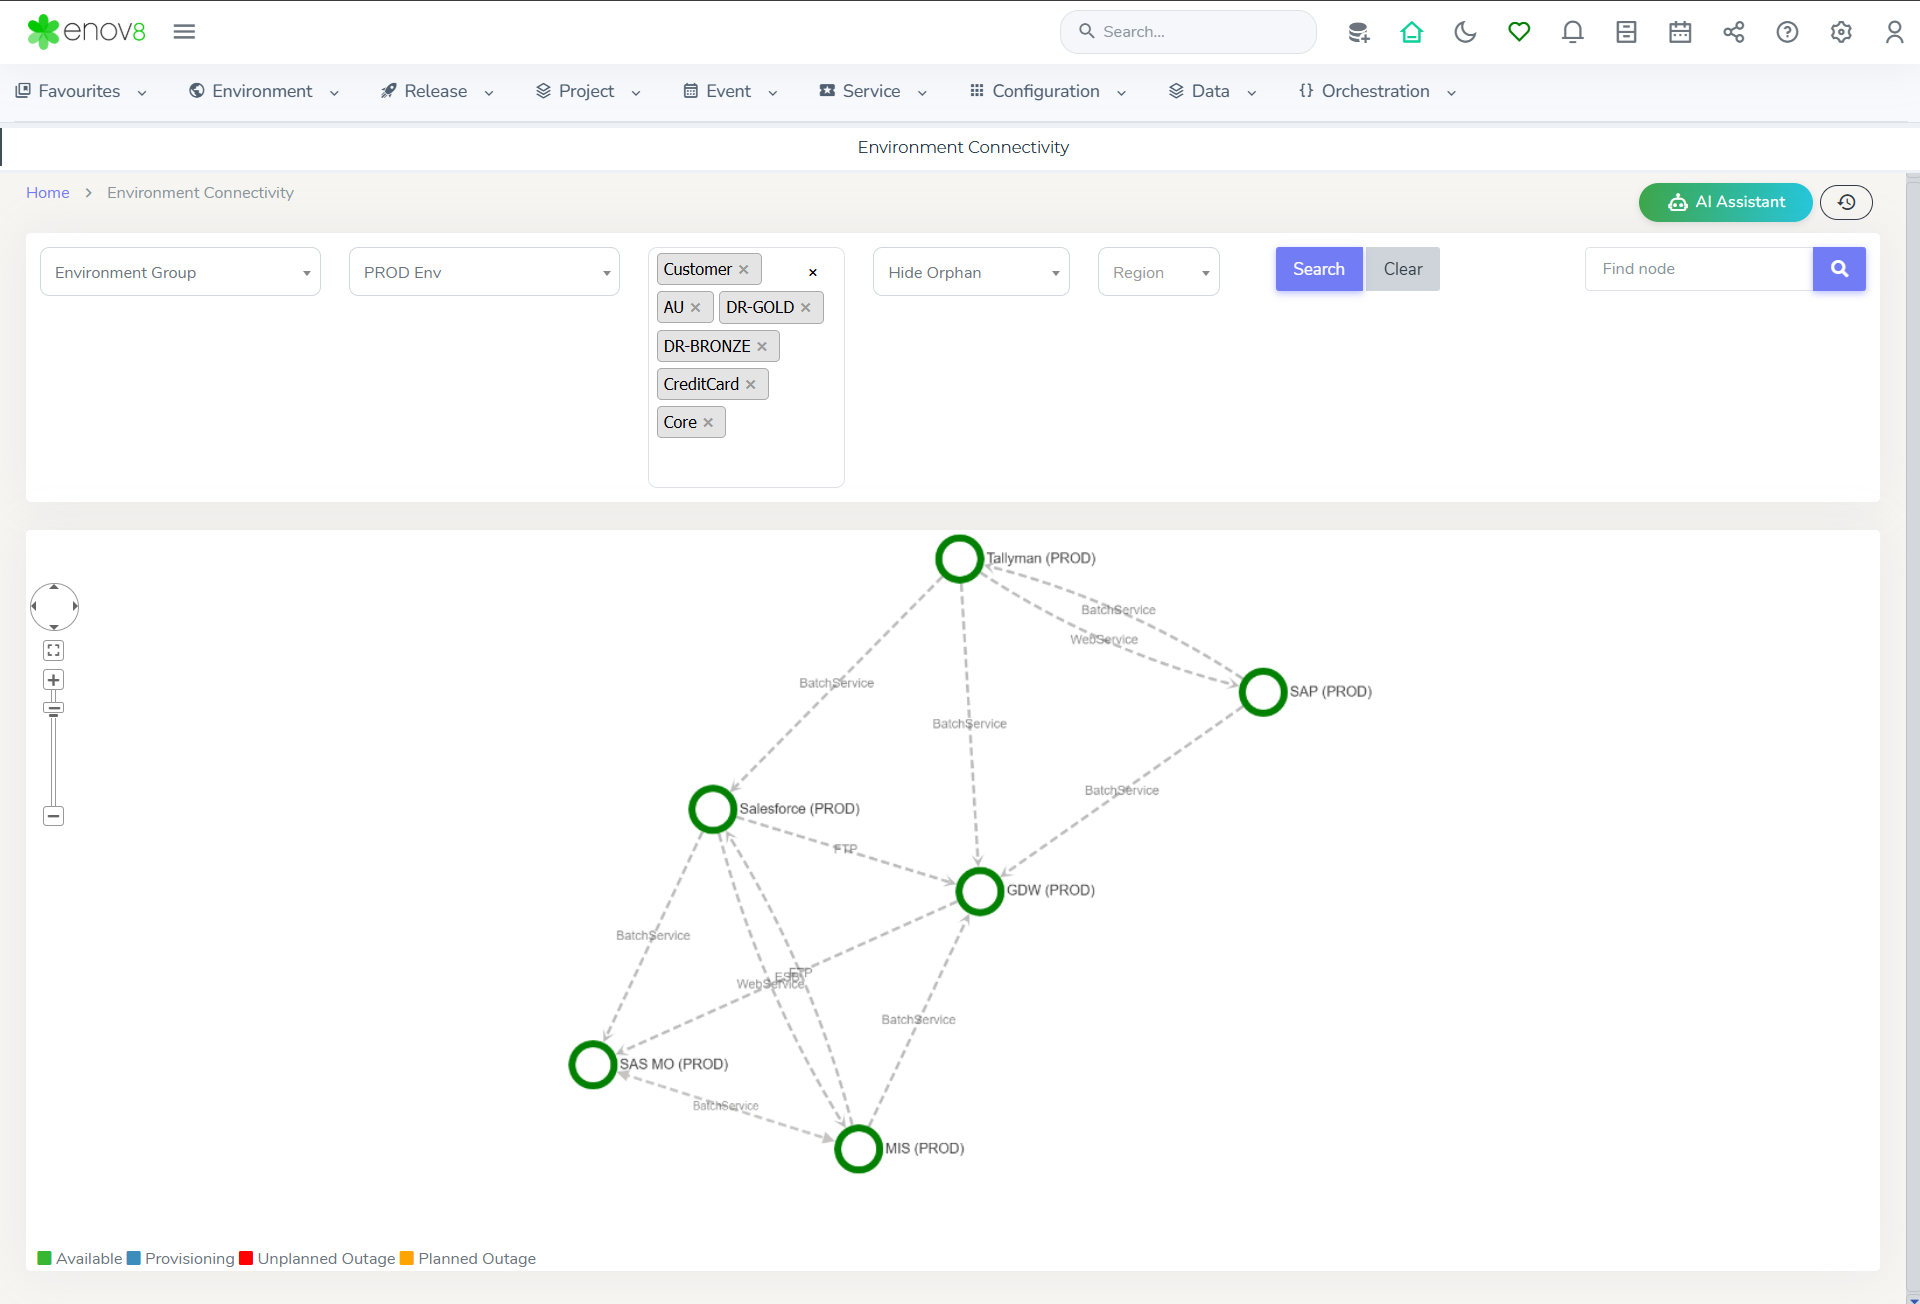
Features of the Environment Connectivity Dashboard
-
System Dependency View: This view displays the connectivity between different systems based on the dependencies that have been defined, aiding in understanding the interdependencies of systems.
-
System Composition: Focuses on a selected system's composition, showcasing its instances and the associated components, providing a detailed look at the system's internal structure.
-
Environment Group: Highlights the Environment Instances within a chosen environment group and illustrates their interconnectivity. This view offers additional filtering by region for each instance, enabling regional analysis.
-
Environment Instance: Concentrates on the connectivity of selected Environment Instances, demonstrating their links with others. It includes an option to filter the view for instances in a specific region.
-
Project: Targets project system demand, showing the connected systems essential for the project, thus offering insights into project-specific infrastructure needs.
-
Booking: Focuses on booking details, revealing the Environment Instances linked to the booked instances, which might be crucial for project execution.
This dashboard serves as a powerful tool for IT professionals and managers, providing critical insights into the connectivity and dependencies within their IT environment, facilitating better planning, risk management, and decision-making.
Blueprints
Blueprints in the Enov8 platform enable users to create visual models that represent various aspects of their IT infrastructure, including IT architecture, business processes, and IT services, like the example of a GDW Deployment Diagram.
Accessing Blueprints
To access and view your blueprints, follow these steps:
- Navigate to Environment.
- Click on VCMDB.
- Select Blueprints.
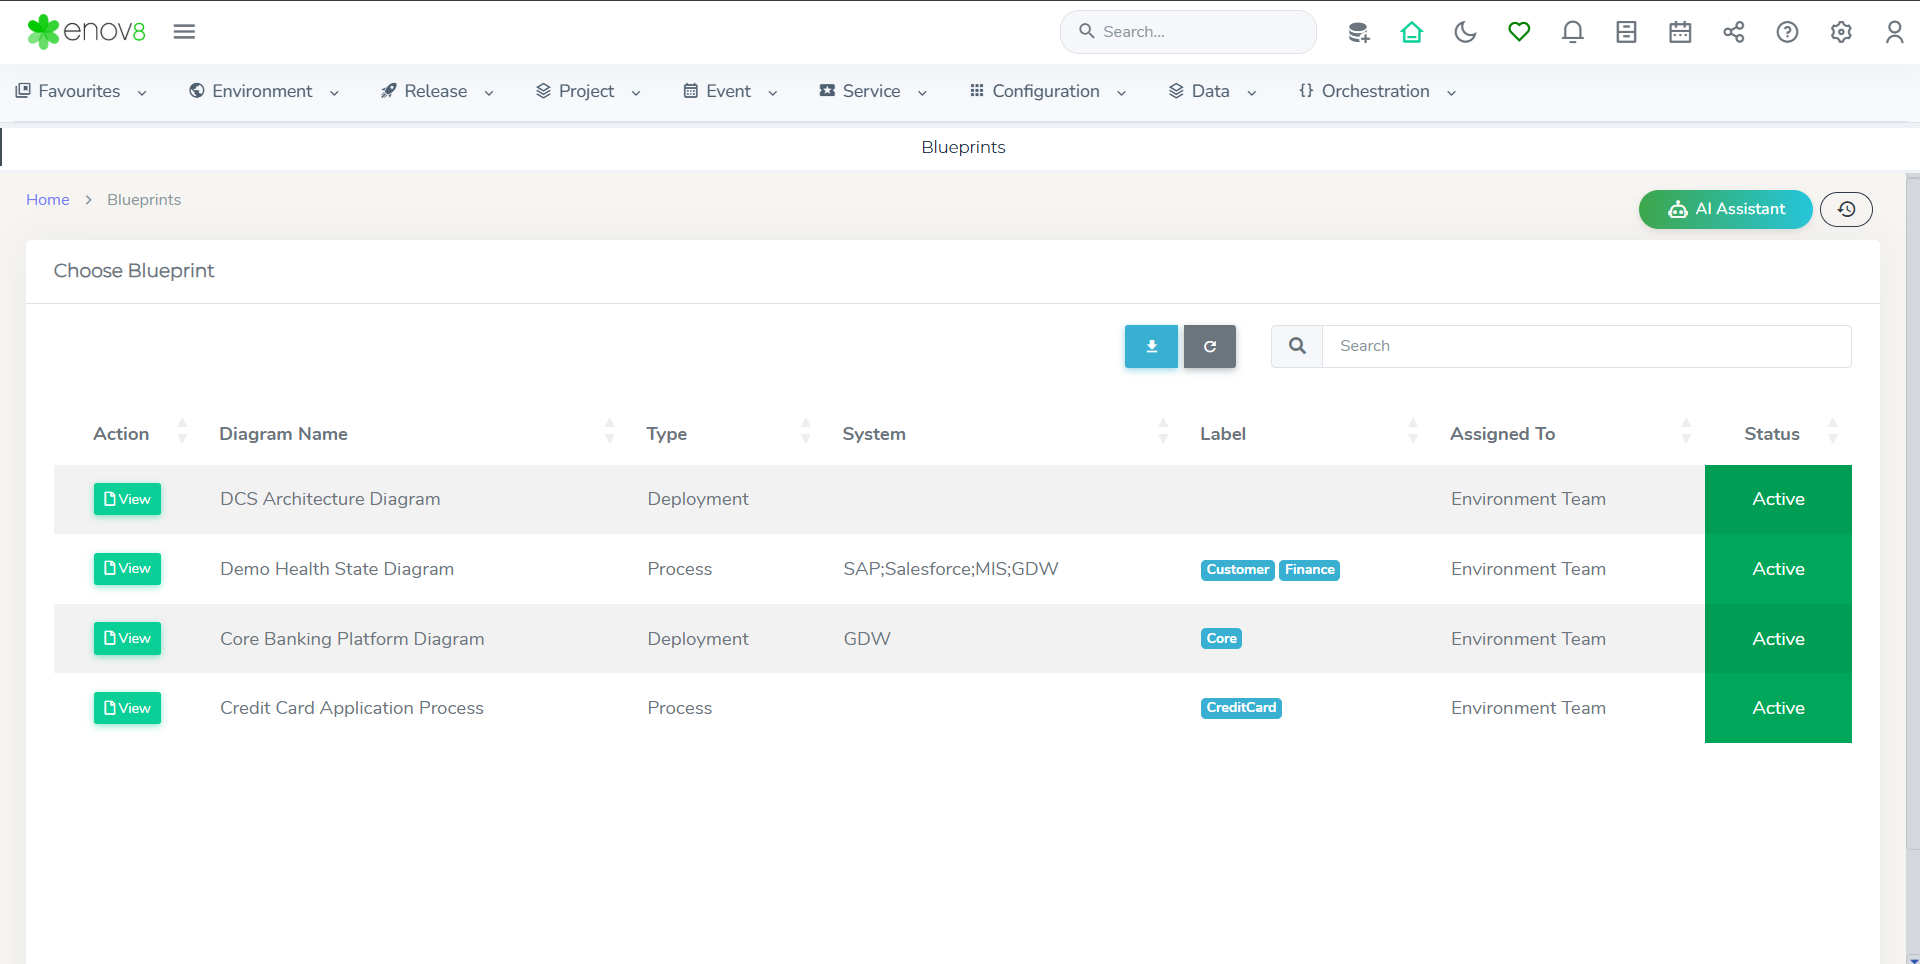
Once in the Blueprints section, you can view a specific blueprint by selecting the View button associated with the blueprint you wish to examine.
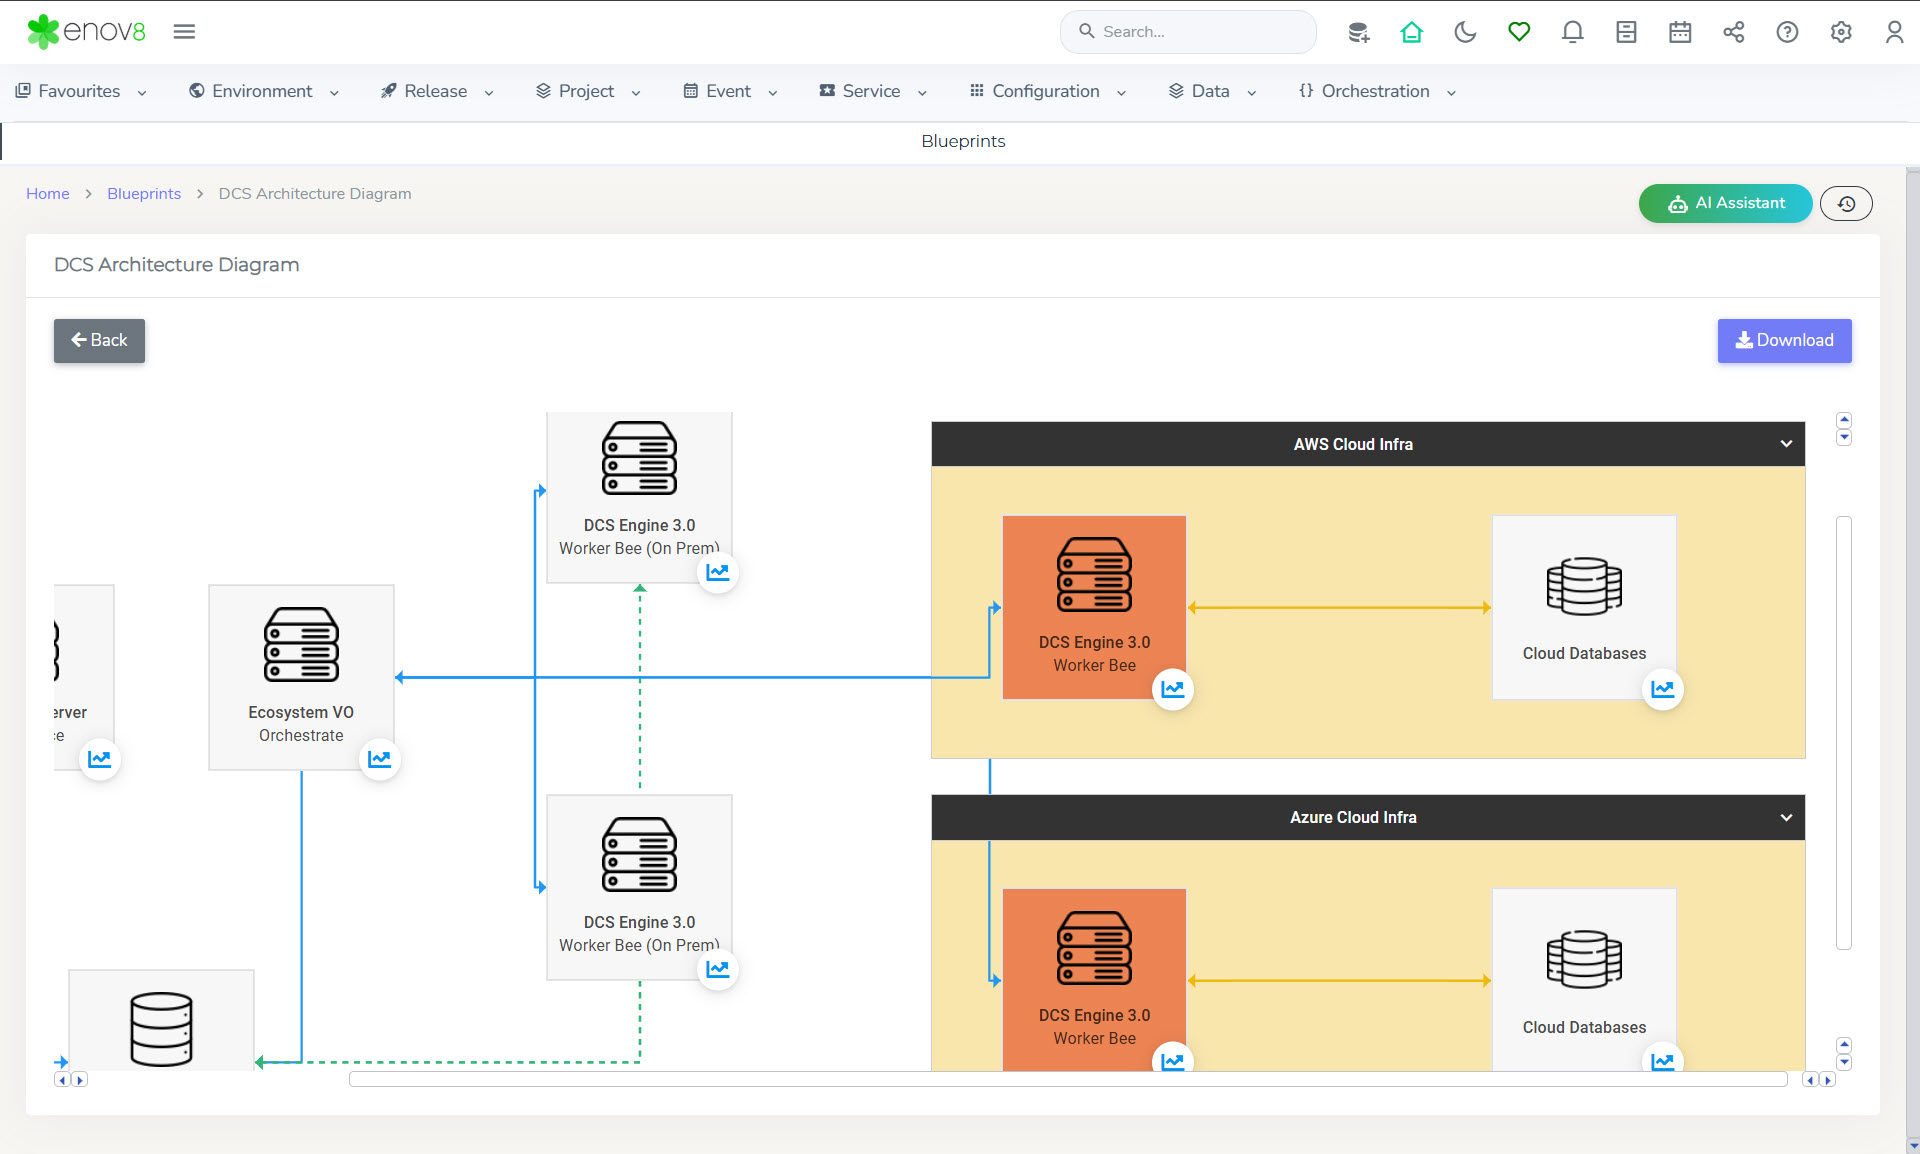
These blueprints offer a graphical representation, making it easier to comprehend and communicate the intricacies of your IT environment and associated processes. This feature is particularly useful for stakeholders who need to understand the layout and relationships within the IT infrastructure, aiding in decision-making, planning, and optimization of IT services and architecture.
Interface Matrix
The Interface Matrix dashboard within the Enov8 platform is designed to help users visualize the relationships and interactions between different instances through system interfaces, providing a clear picture of how components within the IT environment are interconnected.
Accessing the Interface Matrix Dashboard
To view this dashboard, follow these steps:
- Navigate to Environment.
- Click on VCMDB.
- Select Interface Matrix.
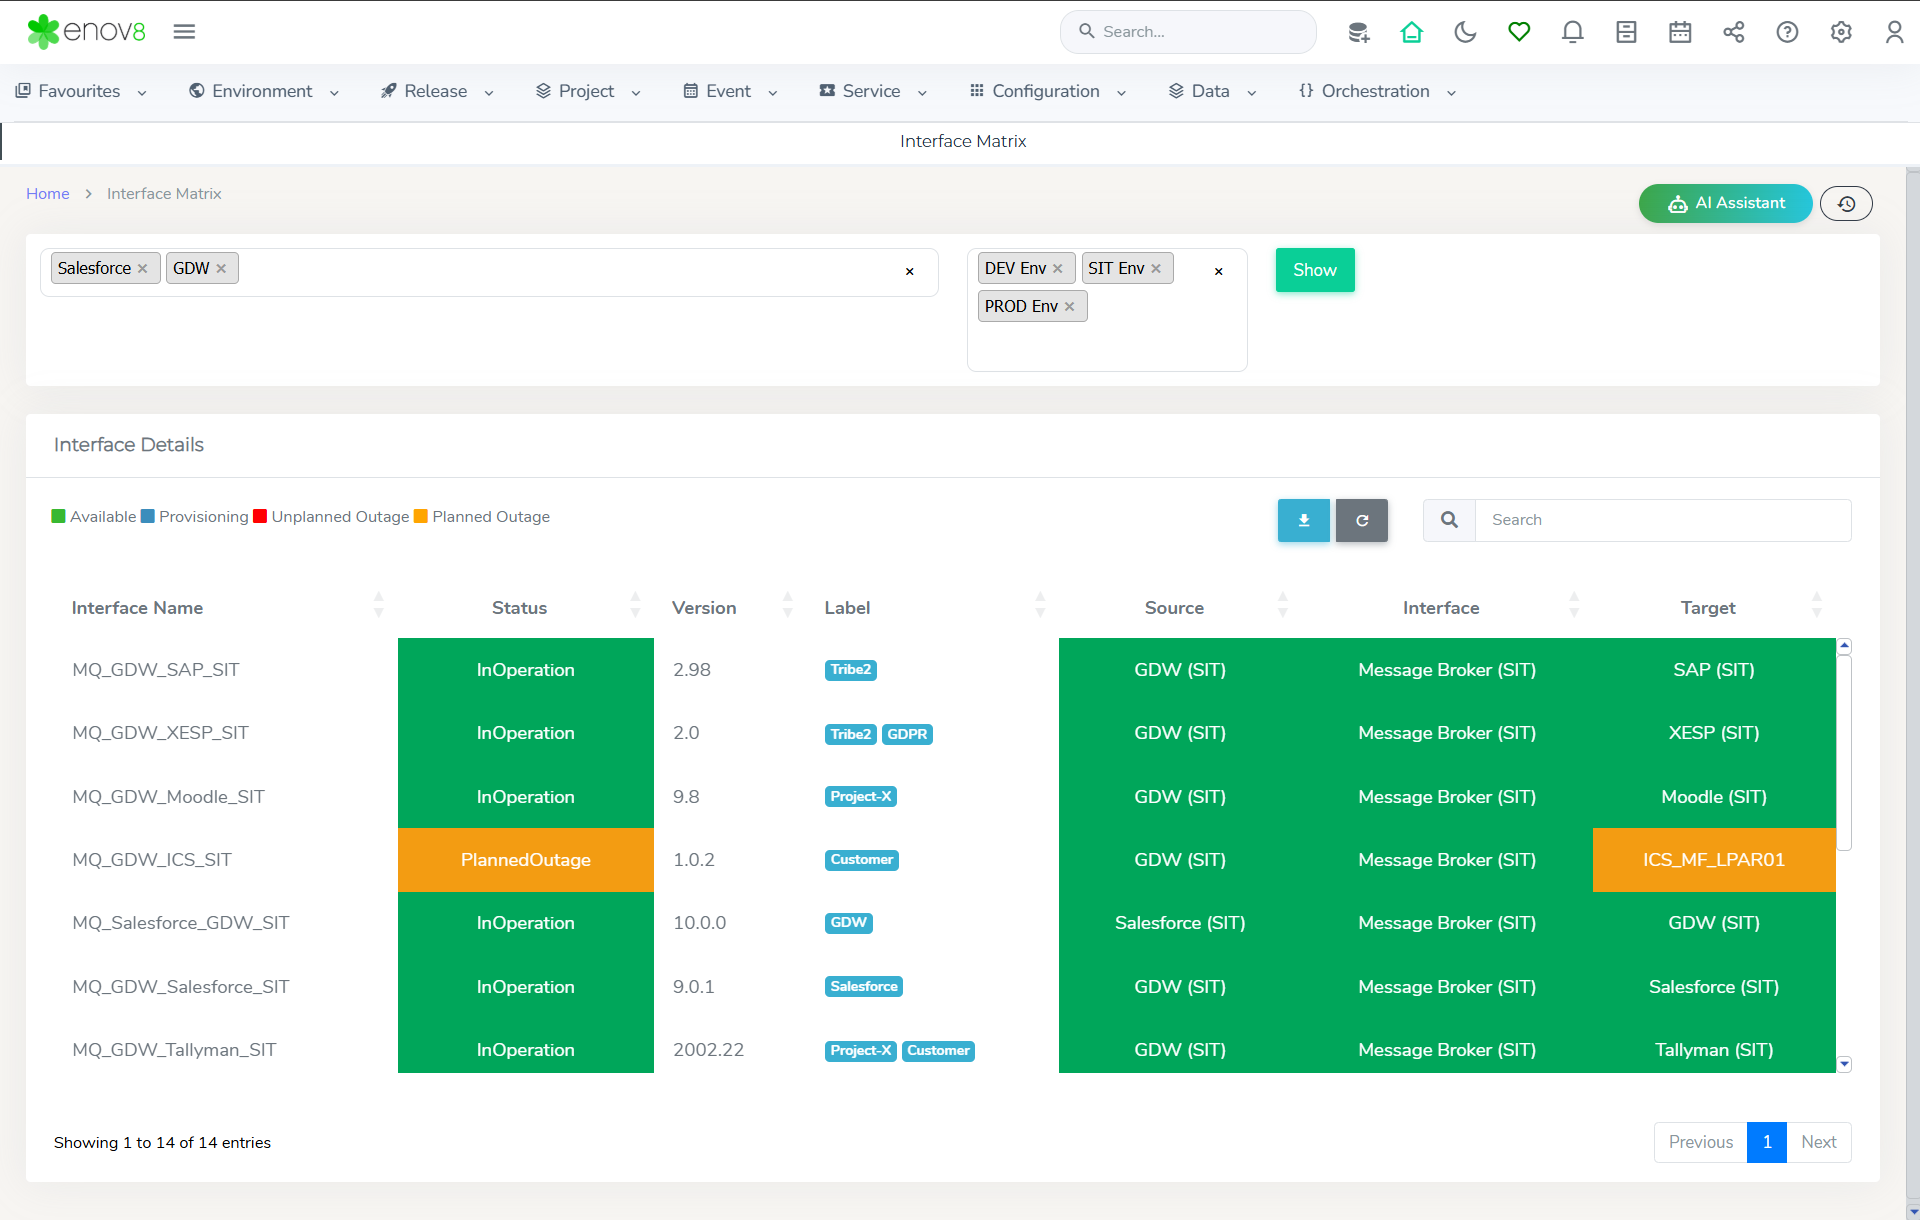
Once you're in the Interface Matrix section, you can choose the specific Systems and Environment for which you wish to view the interfaces. This selection process allows you to tailor the visualization to your specific needs, offering a focused view on the interconnections and dependencies that are most relevant to your analysis or operational focus.
This dashboard is invaluable for IT professionals who need to understand the intricate web of connections between different system instances, aiding in tasks such as troubleshooting, impact analysis, and system architecture optimization.
Fact Sheets
A Fact Sheet is designed to capture and store critical information about a system. This data can span across multiple categories, such as Application Stack, Resilience, Security, Compliance, Data, or any custom categories you wish to create. Fact Sheets act as a centralized repository for key system details, providing comprehensive insights for stakeholders and supporting well-informed decision-making processes.
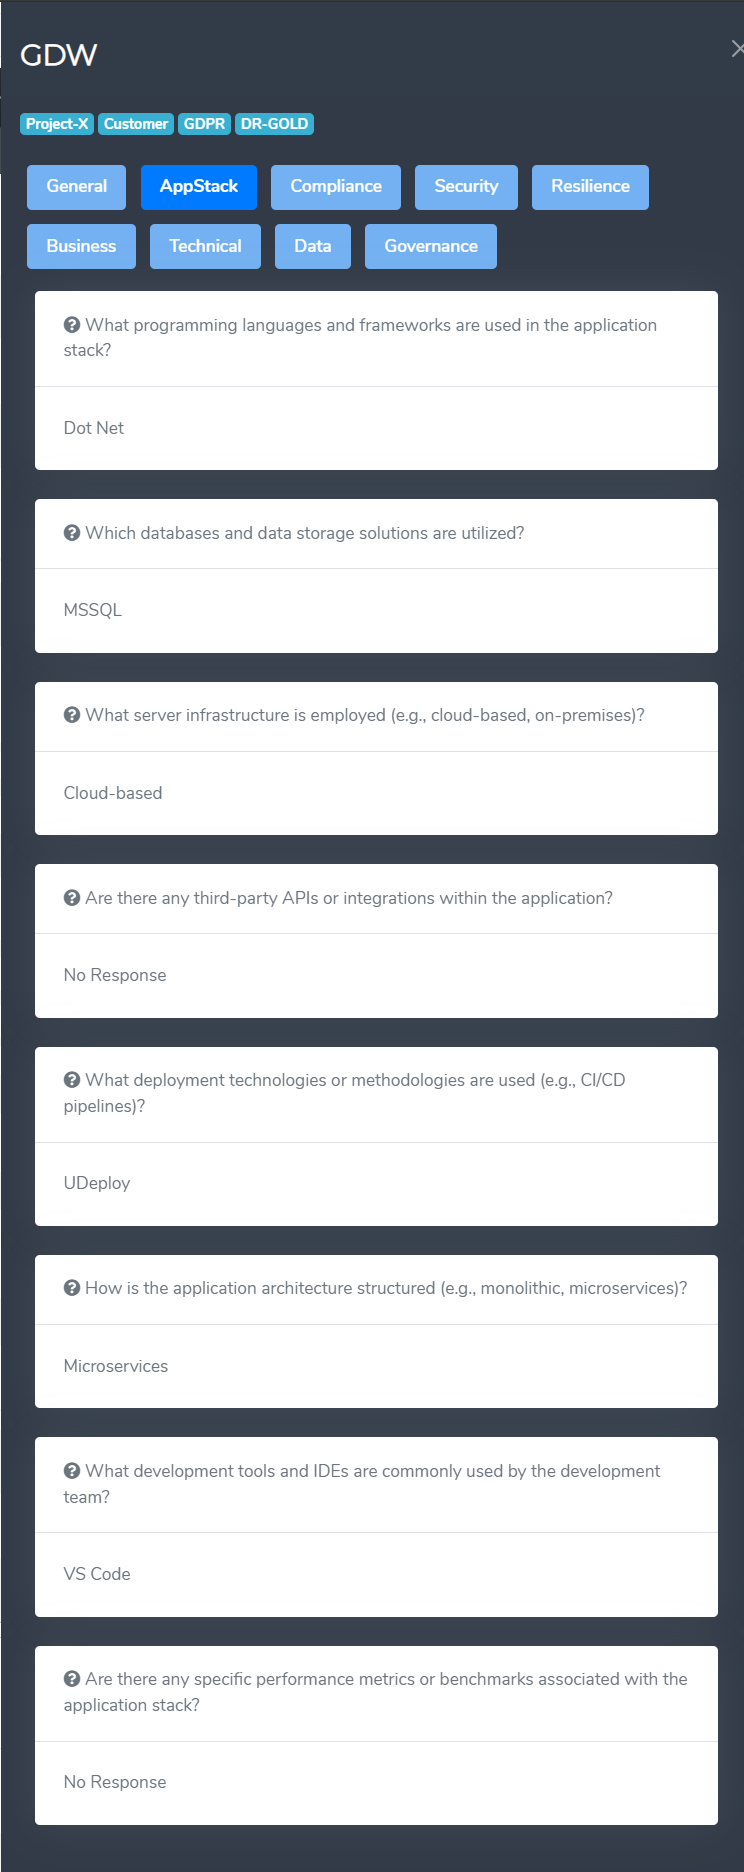
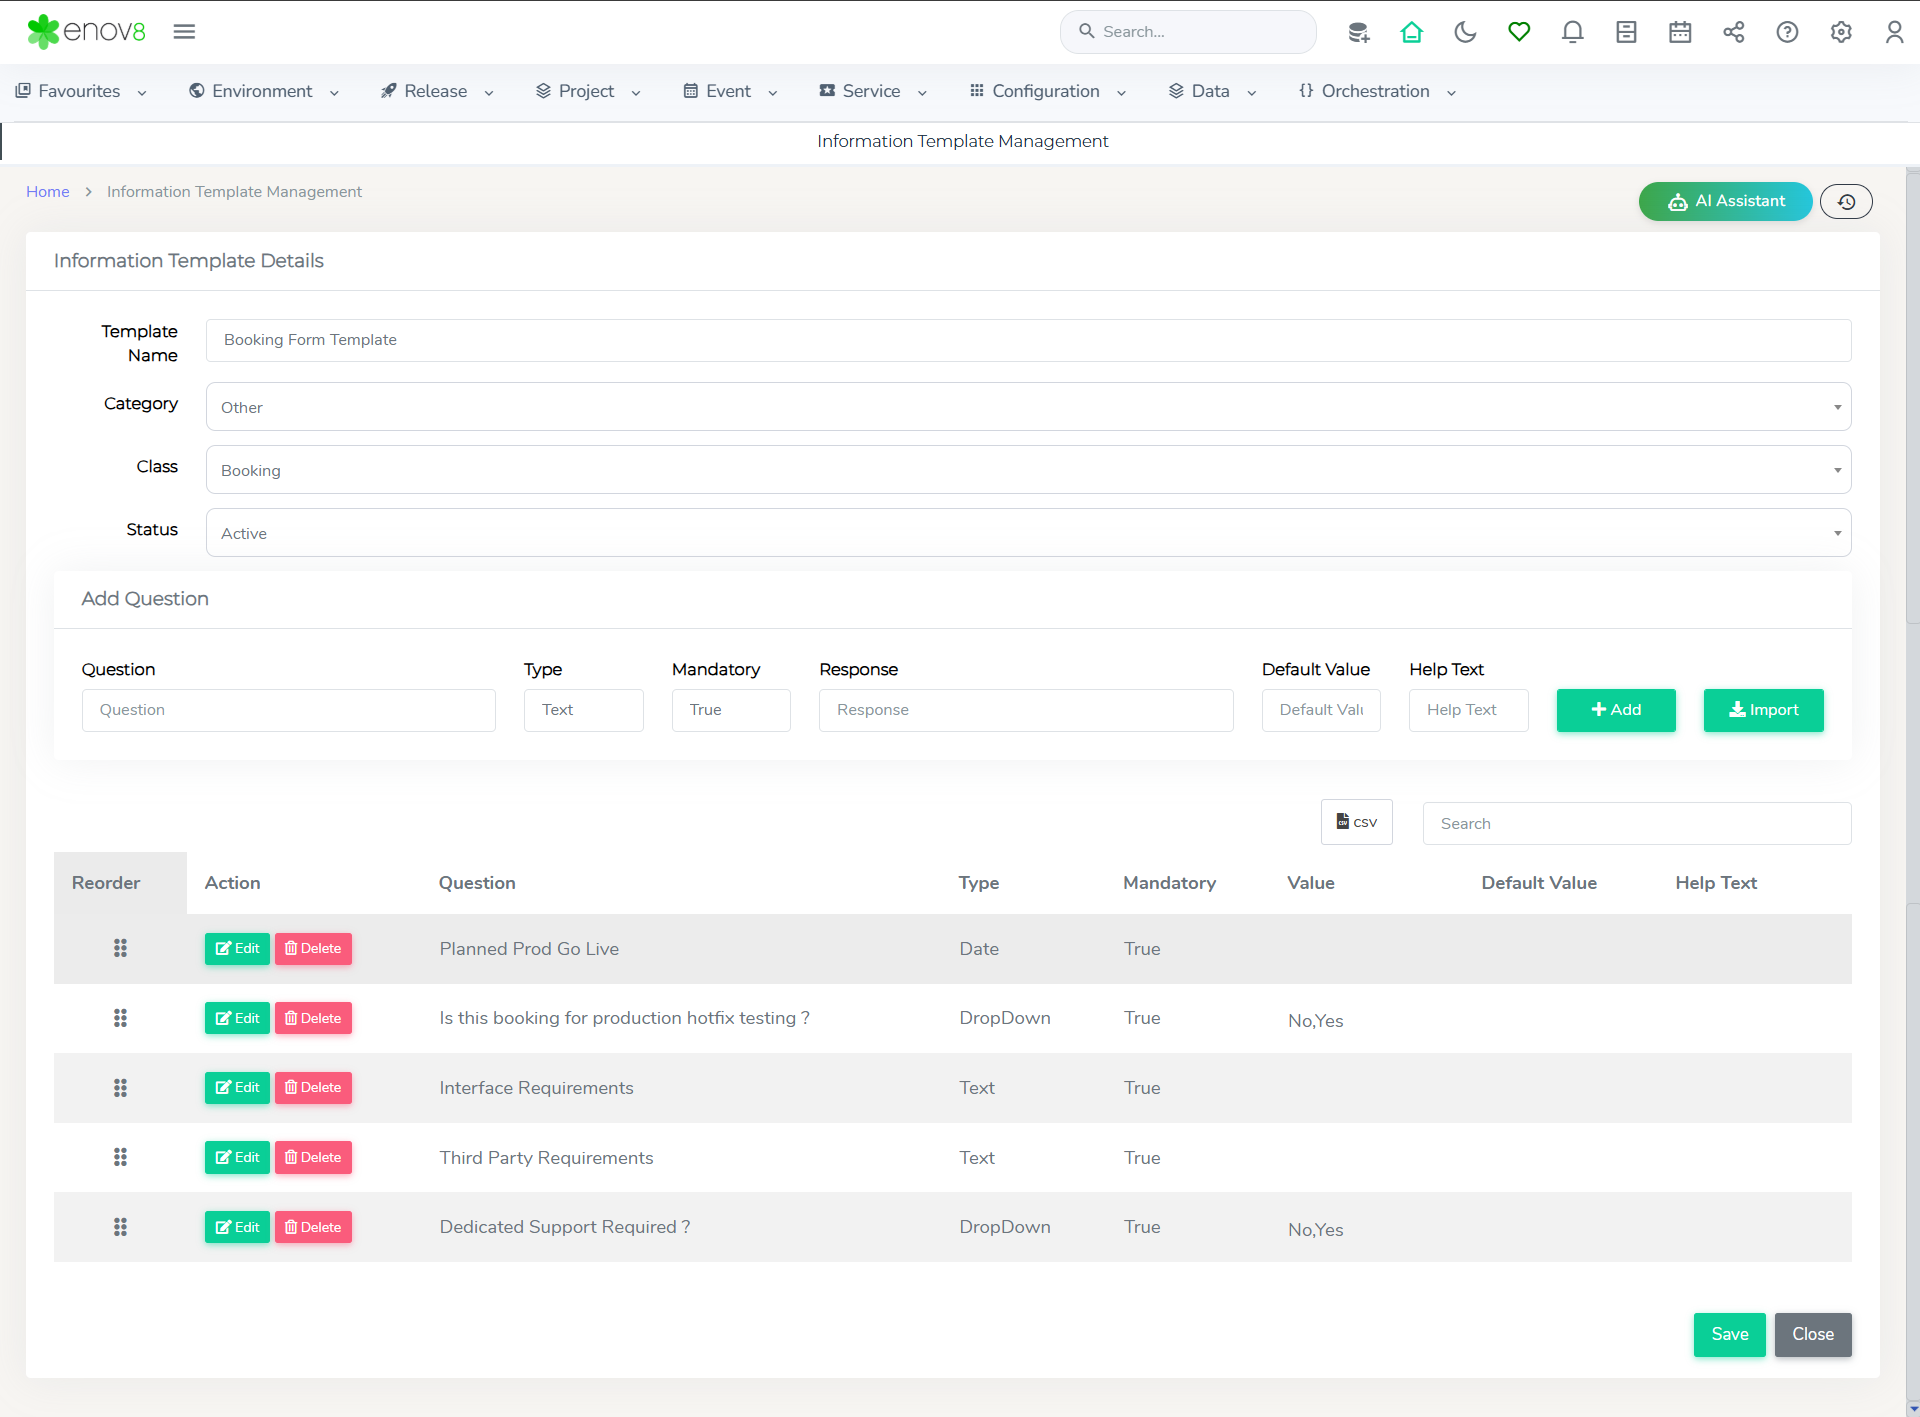
Fact Sheet Template
Fact Sheet template allow admin to create a set of questions which they would like to capture for a system under a specific category. Once a template is created, system owners can provide the response to these questions for their specific system either via fact sheet popup or using survey feature.
To create a fact sheet template, simply navigate to Configuration >> System Administration >> Information Template Management and click on the Add button.
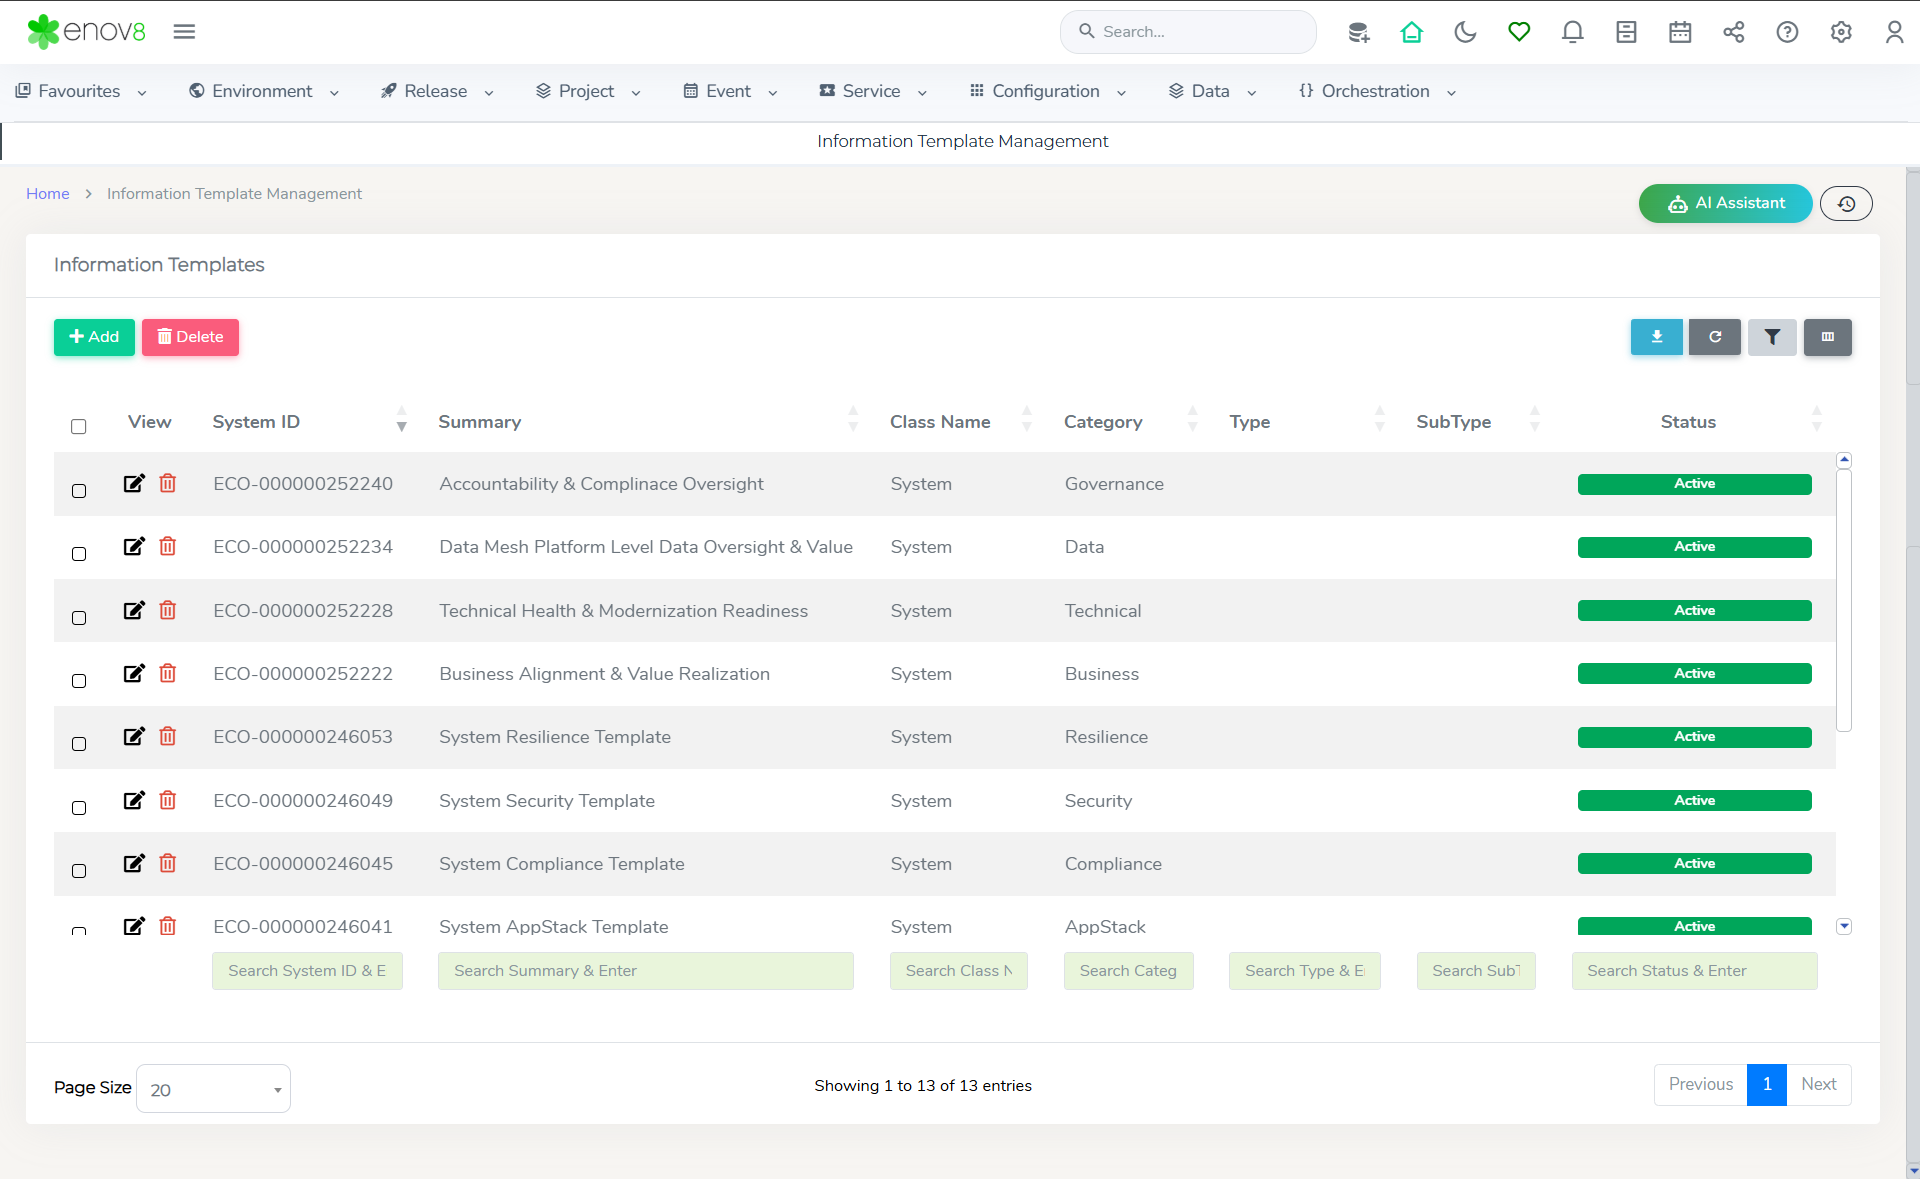
Information Templates supports 4 types of question format - Text, Dropdown, Date & Date Time. Questions can also be marked as mandatory and non-mandatory.
Fact Sheet Response
To provide a response to the fact sheet template, system owner can click on their respective system view which will open a quick view with different tabs for each fact sheet category. Simple clicking on the response section will allow them to provide information about the question.
Surveys
Surveys in the Enov8 platform are designed to streamline the collection of information from system owners related to various Fact Sheets. The survey feature simplifies this process by allowing users to submit their responses via email with a single click, removing the need to log into the platform for each individual system.
Survey Creation
To create a new survey, follow these steps:
- Navigate to Configuration >> System Administration >> Survey Manager.
- Click on the Add button to start creating your survey.
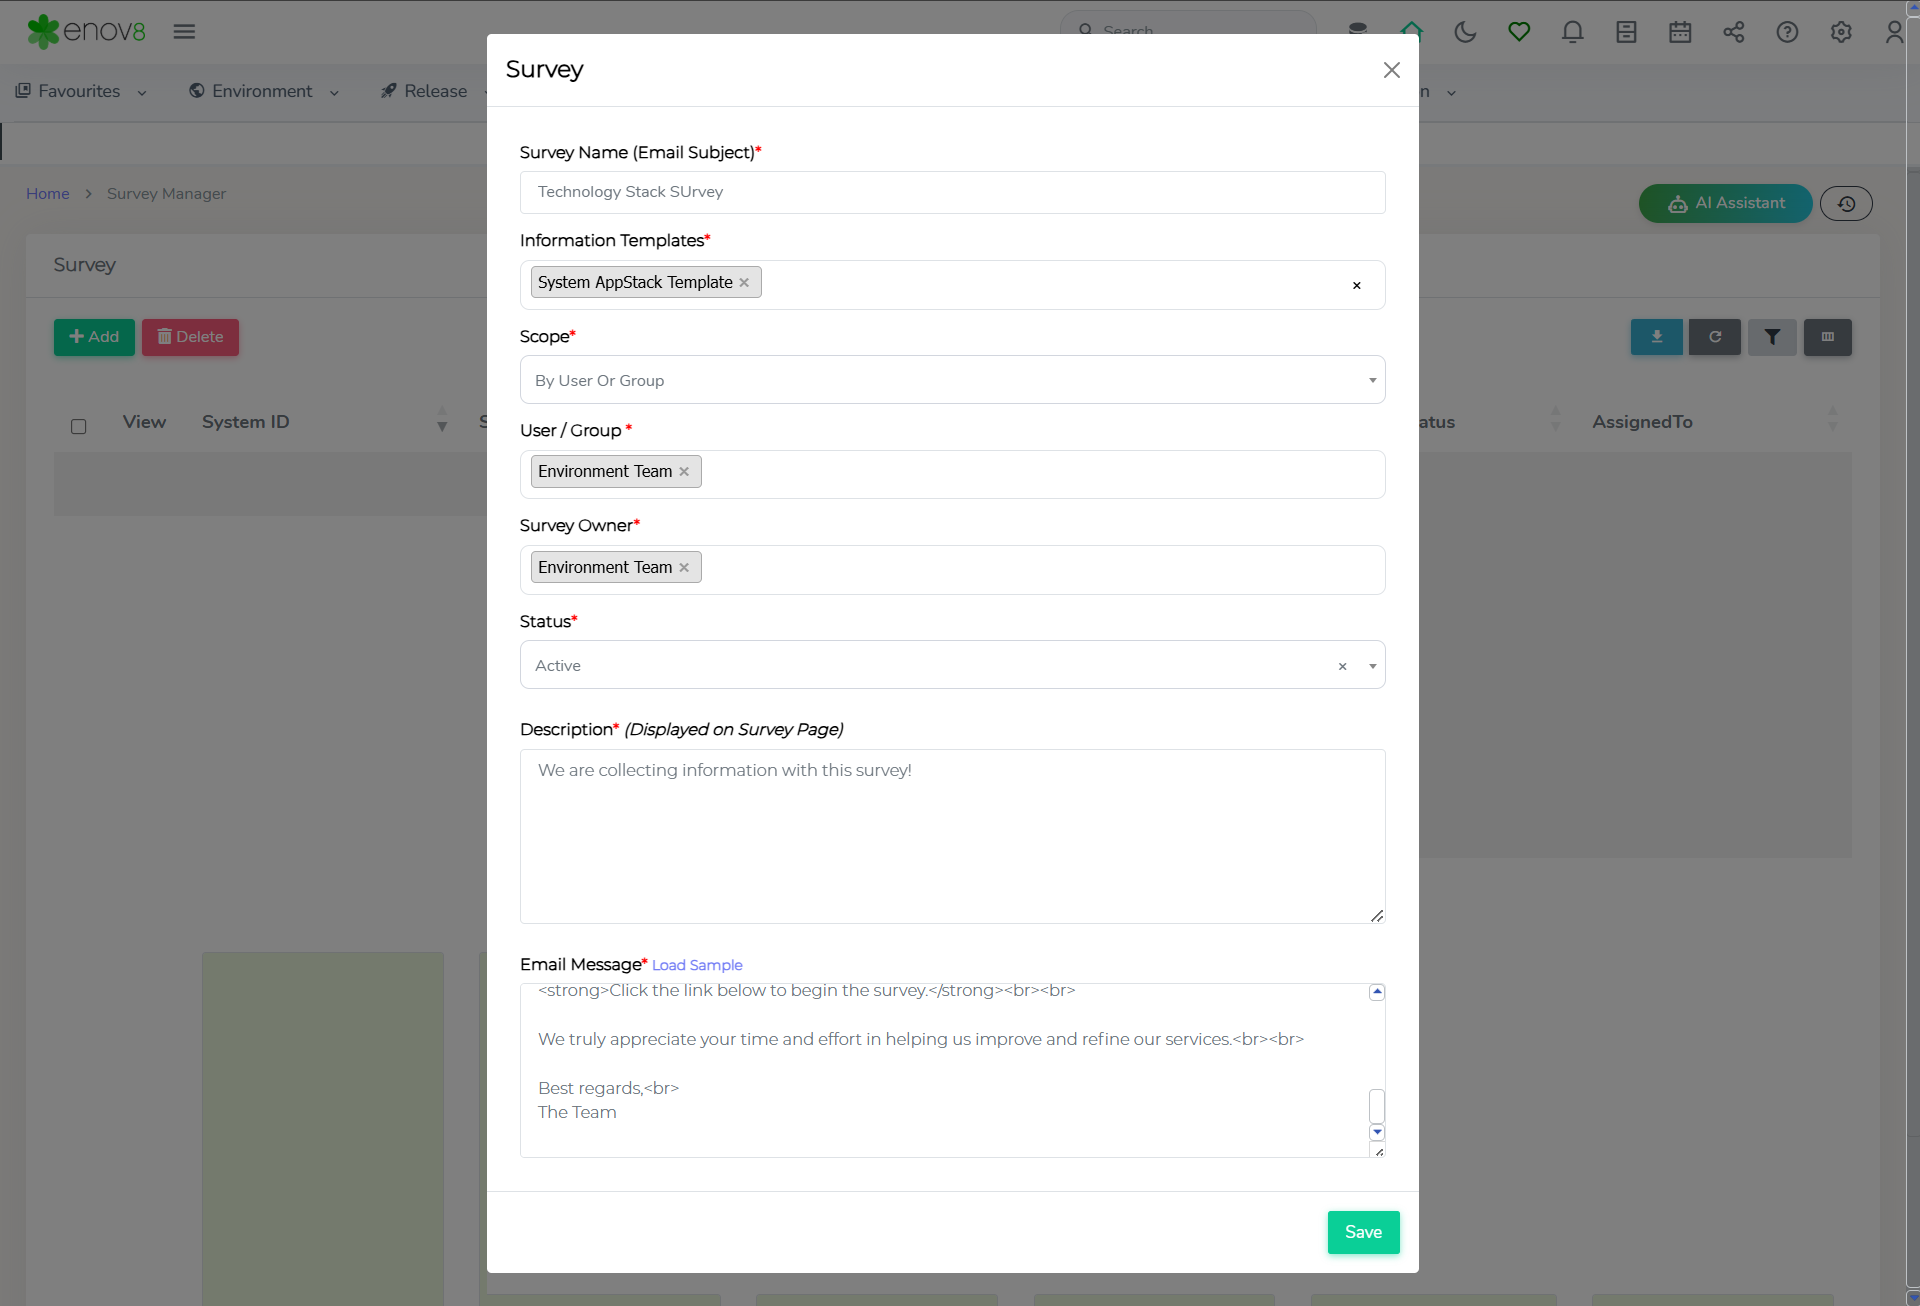
| Property | Description |
|---|---|
| Survey Name | The subject line of the survey email. |
| Information Template | Fact sheet templates which will be used to build the survey |
| Scope | Defines the systems that will be included in the survey. All Systems: Distribute the survey across all systems in the platform. If selected, the email will be sent to all users or groups assigned to any system. By System: Target specific systems or a group of systems. If selected, the email will be sent to all users or groups assigned to the selected systems. By Business Unit: Limit the survey to systems within a particular business unit. If selected, the email will be sent to all users or groups assigned to systems in the selected business unit. By User or Group: Assign the survey to a specific system owner or user group. If selected, the email will be sent to the specific users or groups, and the survey will display only the systems for which they are assigned. |
| Survey Owner | The user group or individual responsible for managing the survey. |
| Description | A brief description of the survey, displayed on the survey page. |
| Email Message | The content of the email sent to system owners as part of the survey process. |
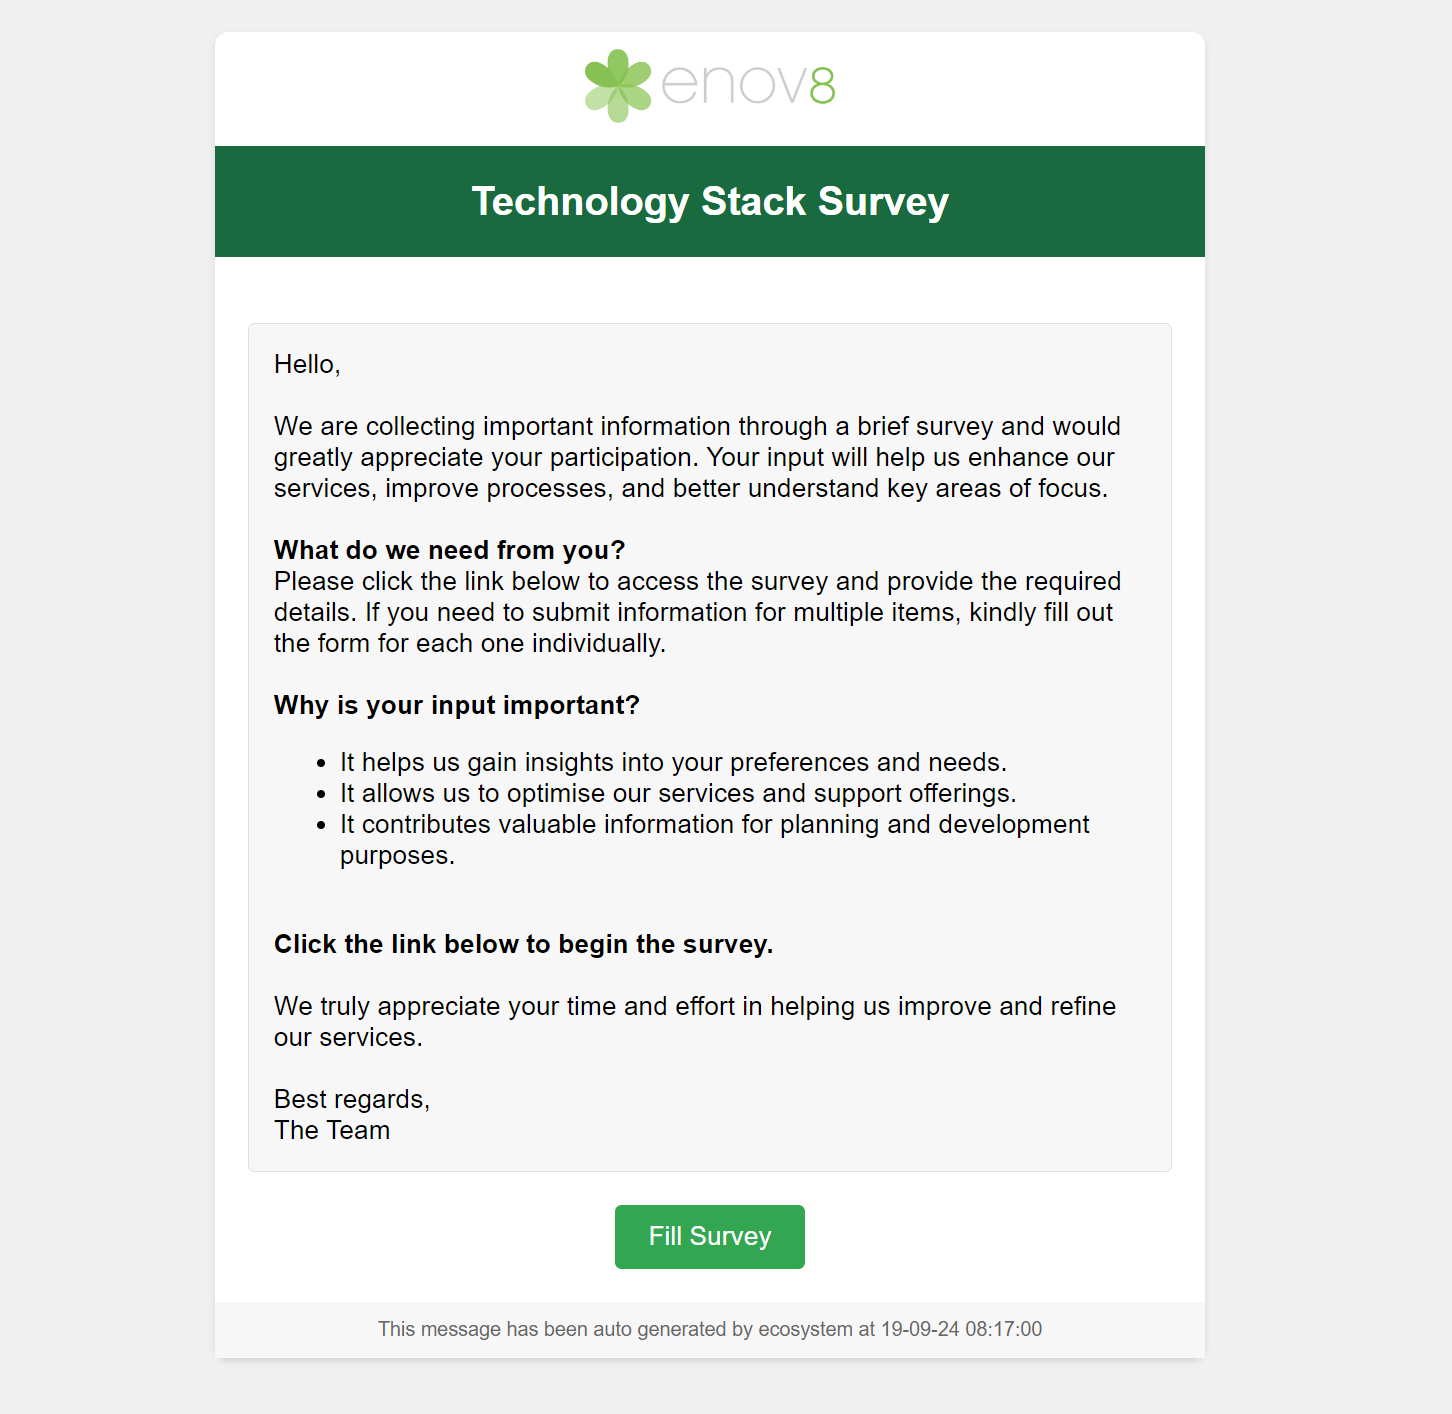
Sample Survey Email
Survey Execution
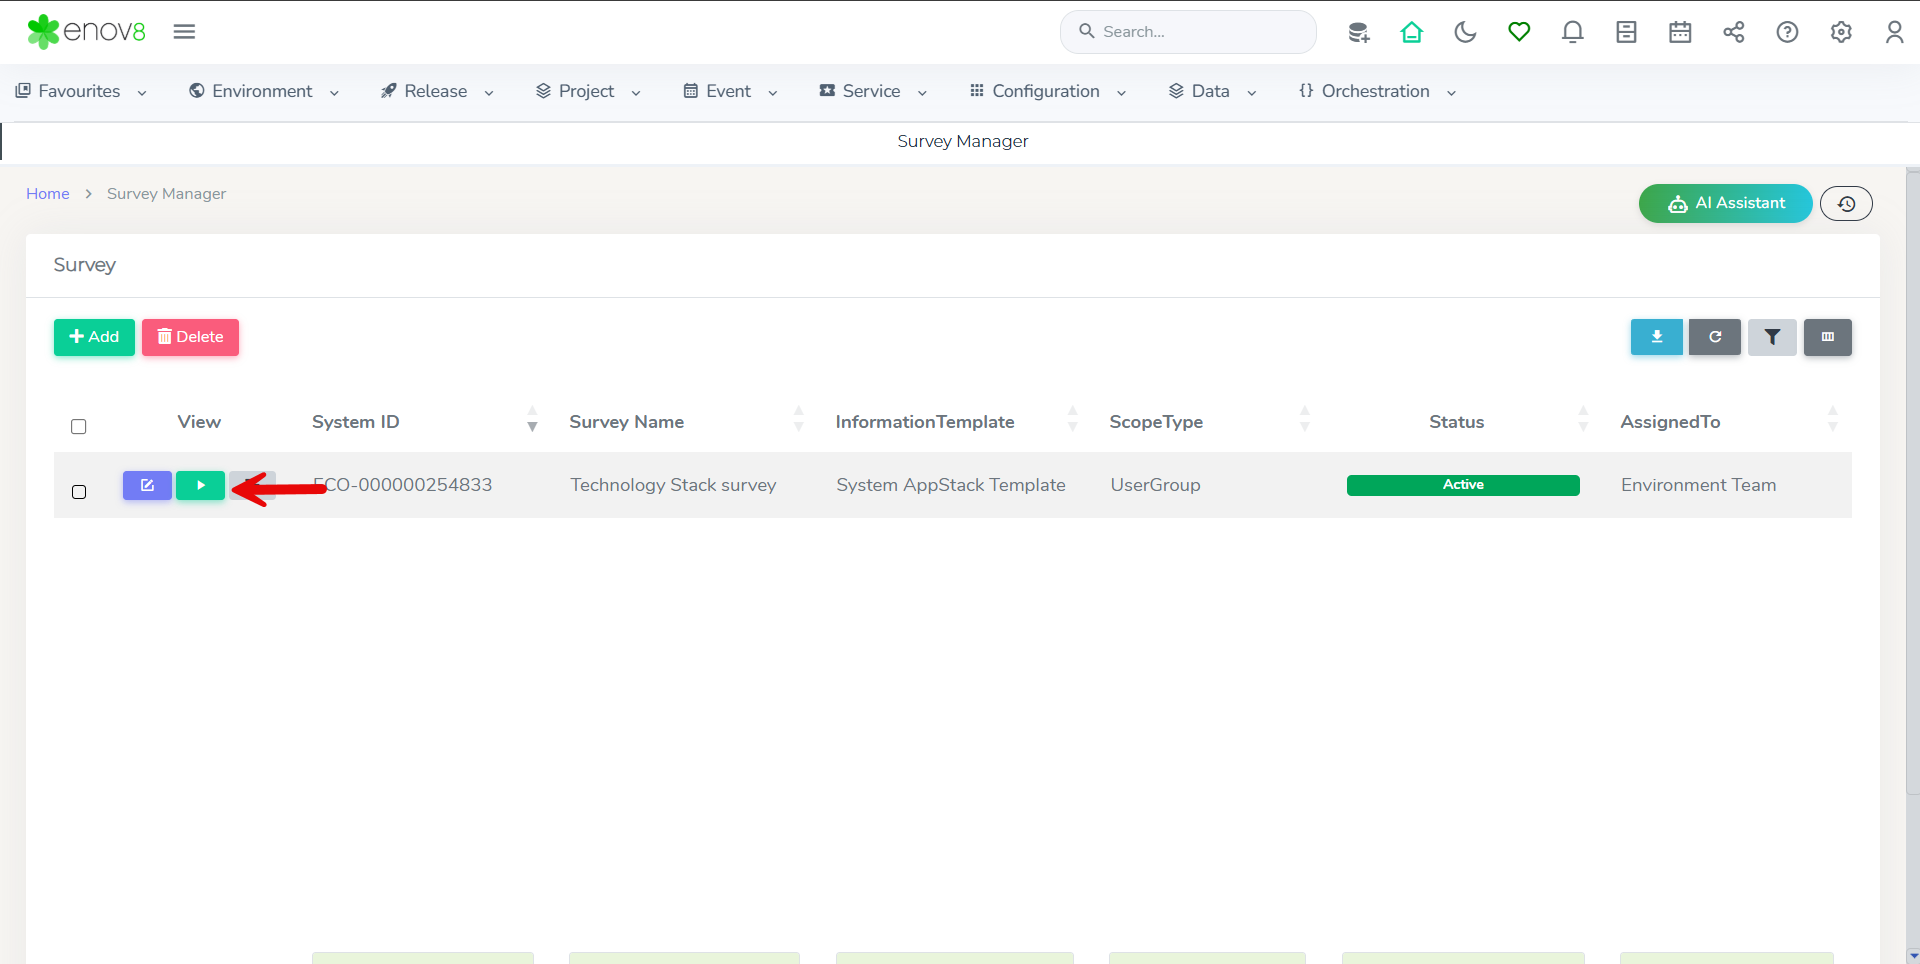
Once the survey is created, you can send out the survey emails by clicking the Execute button on the listing page. The survey emails are sent automatically to the selected recipients at intervals of one hour.
Survey Response
When system owners receive the survey email, they can respond by clicking on the "Fill Survey" button, which will direct them to the survey page.
On the survey page, users will:
- Select the system from a dropdown list, which shows systems they are responsible for based on the survey scope.
- Answer the survey questions related to the selected system.
- Submit their response by clicking the Submit button.
After submitting, users can choose another system from the dropdown and fill out responses for that system as well. All collected information will be automatically populated in the associated Fact Sheet.
If multiple users are assigned the same system and Fact Sheet, the last submitted response will overwrite previous entries.
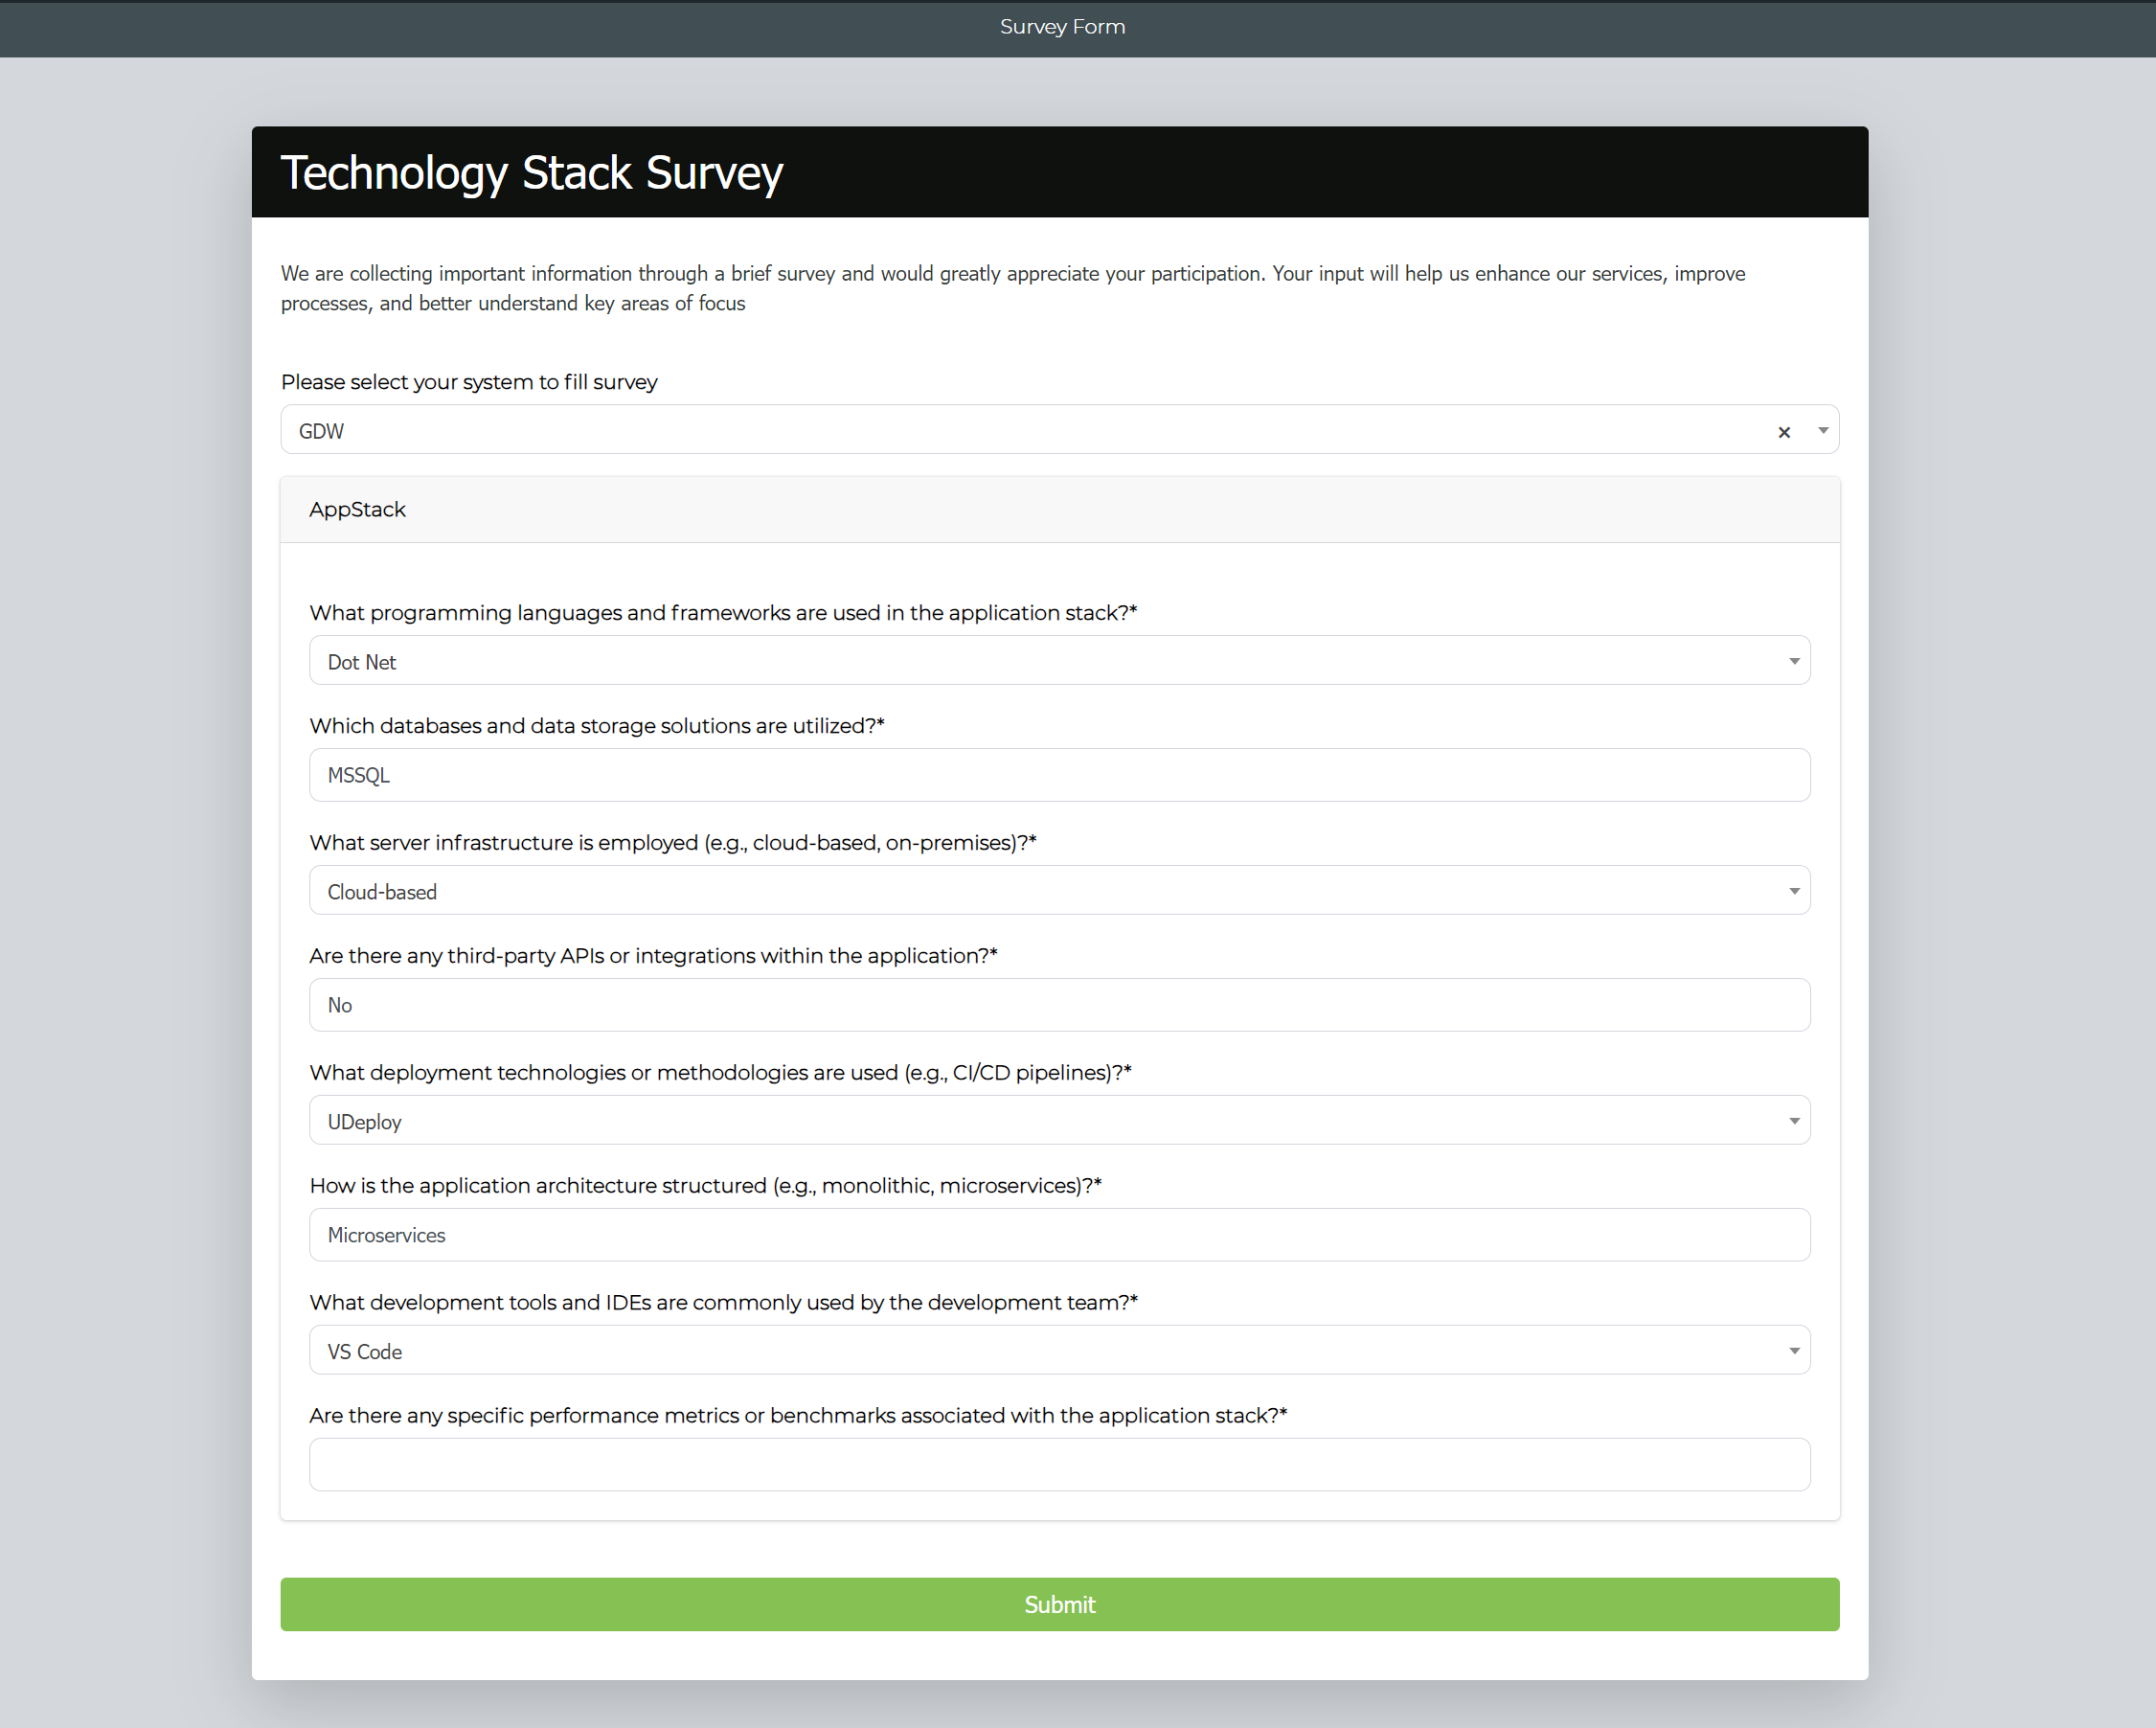
Sample Survey Response Page