Profiling
Overview of Profiling
The first step of the process is to Profile your Data Source. Profiling, scans the data source and determines, with a degree of certainty, the type of data in the column. During the process a Data Masking configuration file and a Data Validation (Audit) configuration file is generated as per the TDM solution.
Profile Configurations
The rulesets and patterns scanned as part of the profiling process are defined in Profile Configurations.
Navigate to Data Management Hub > Manage Configurations > Profile Configurations. Here you can Add, Edit, Clone or Delete a Profile Configuration.

Adding a Profile Configuration
Click the Add Profile Configuration button. This will present a new Profile Configuration form for adding the following information.
Note: You can add a default sample by clicking the "Load Sample" button.
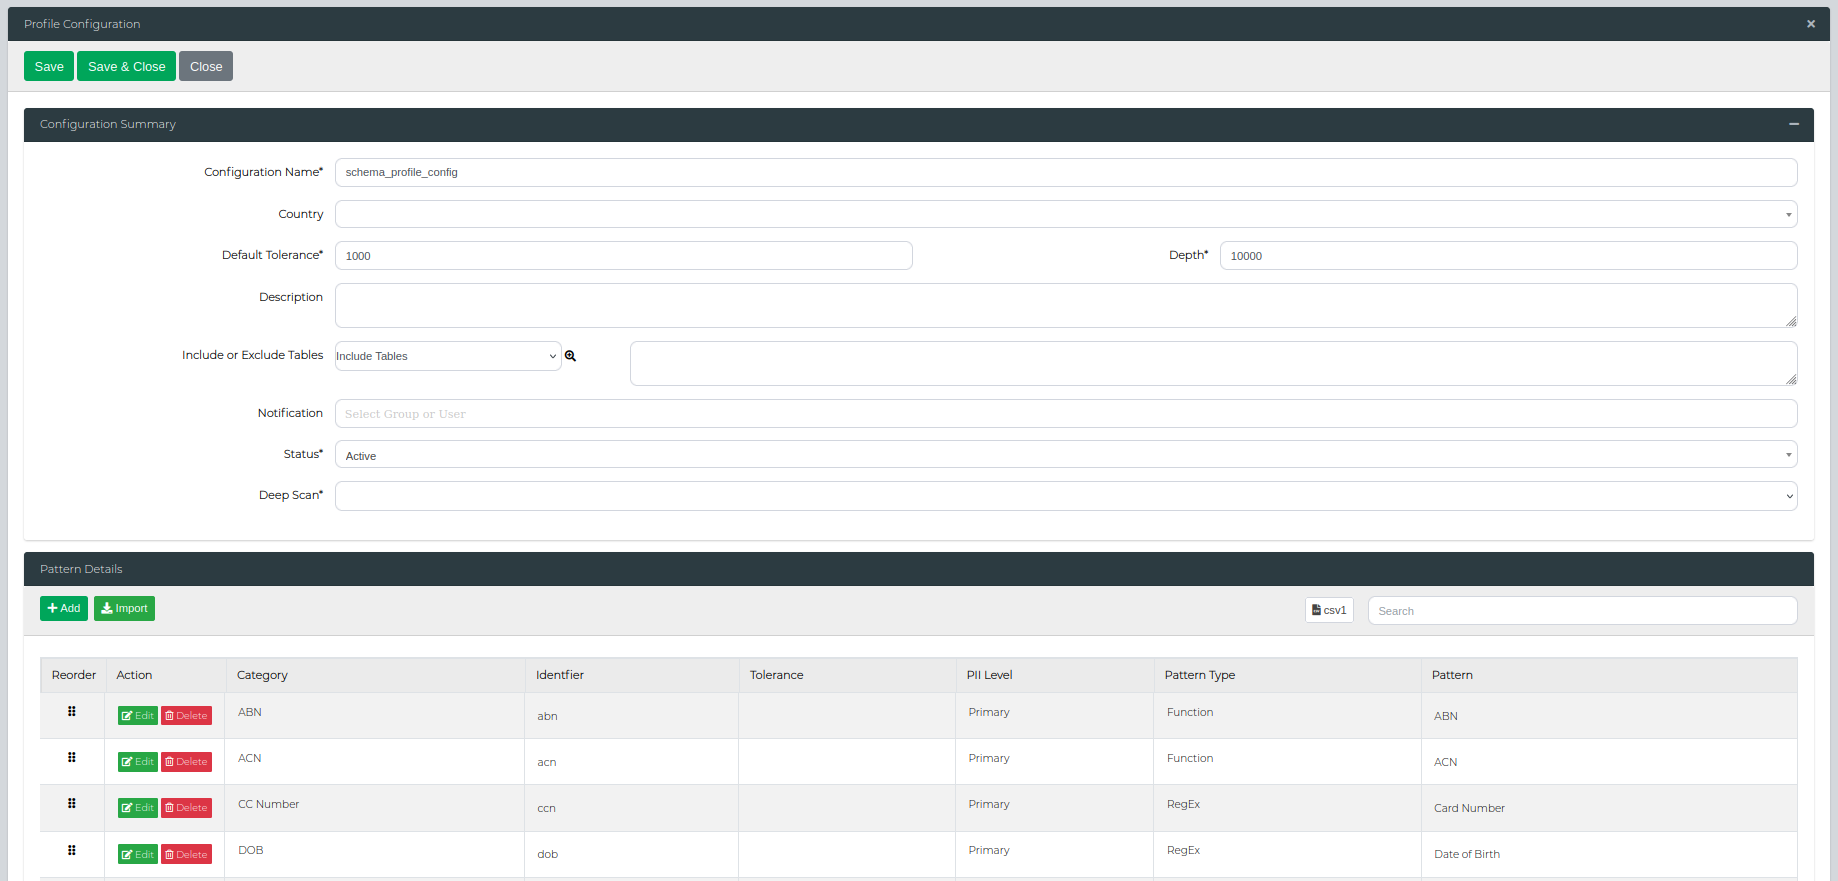
On the Profile Configuration form, you can edit the following configuration information.
| Type | Description |
|---|---|
| Configuration Name | The profile configuration name. |
| Default Tolerance | The default quantity of matches for it to be classified as a pattern. |
| Depth | The number of maximum records to search. (Note: The higher this is set, the slower the profile will be). |
| Description | The profile configuration description or long name. |
| Country | The country or language to which the respective configuration may apply. (This field can be null.) |
| Include/Exclude Table | The tables to exclude from profiling or alternatively only include for profiling. |
| Notification | List of users who will be notified. |
| Status | Set the profile to Active for use or Draft/Inactive to hide it from the Profile Execution area. |
| Deep Scan | An advanced feature that ignores null values when identifying PII data. This is advantageous in an empty table that may contain PII. |
| Thread Count | The number of concurrent threads used to scan (ranging from 1 to 64) and process table data simultaneously to optimise performance. |
Add/Edit Pattern(s) section:
| Type | Description |
|---|---|
| Category | The pattern category. (This filters the results visible in the Pattern drop list). |
| Identifier | Pattern Name used in the profile config. |
| Tolerance | Overrides the default tolerance with a specific tolerance. |
| PII Level | Sets the pattern as Primary PII, Secondary PII, or Other. |
| Pattern Type | The pattern type as defined in the Data Library Administration area. |
| Pattern | Pattern which has to be used. |
Once complete, scroll to the top of the main window and click Save to save the Profile or Save & Close to save the config and close the configuration window or Close to Cancel out without saving.
Editing a Profile Configuration
Click the Edit Profile Connection button on the Profile Configuration you want to edit. This will present the Profile Configuration form for modification.
Once complete, scroll to the top of the main window and click Save to save the Profile or Save & Close to save the config and close the configuration window or Close to Cancel out without saving.
Cloning a Profile Configuration
Click the Clone Profile Connection button on the Profile Configuration you want to duplicate. This will present the Profile Configuration form with a duplication of all data for saving as a new Profile Configuration.
Once complete, scroll to the top of the main window and click Save to save the Profile or Save & Close to save the config and close the configuration window or Close to Cancel out without saving.
Deleting a Profile Configuration
Click the Delete Profile Connection button on the Profile Configuration you want to remove. This will present a confirmation window confirming that you want to delete the Profile Configuration or not.
Comparing Profile Configurations
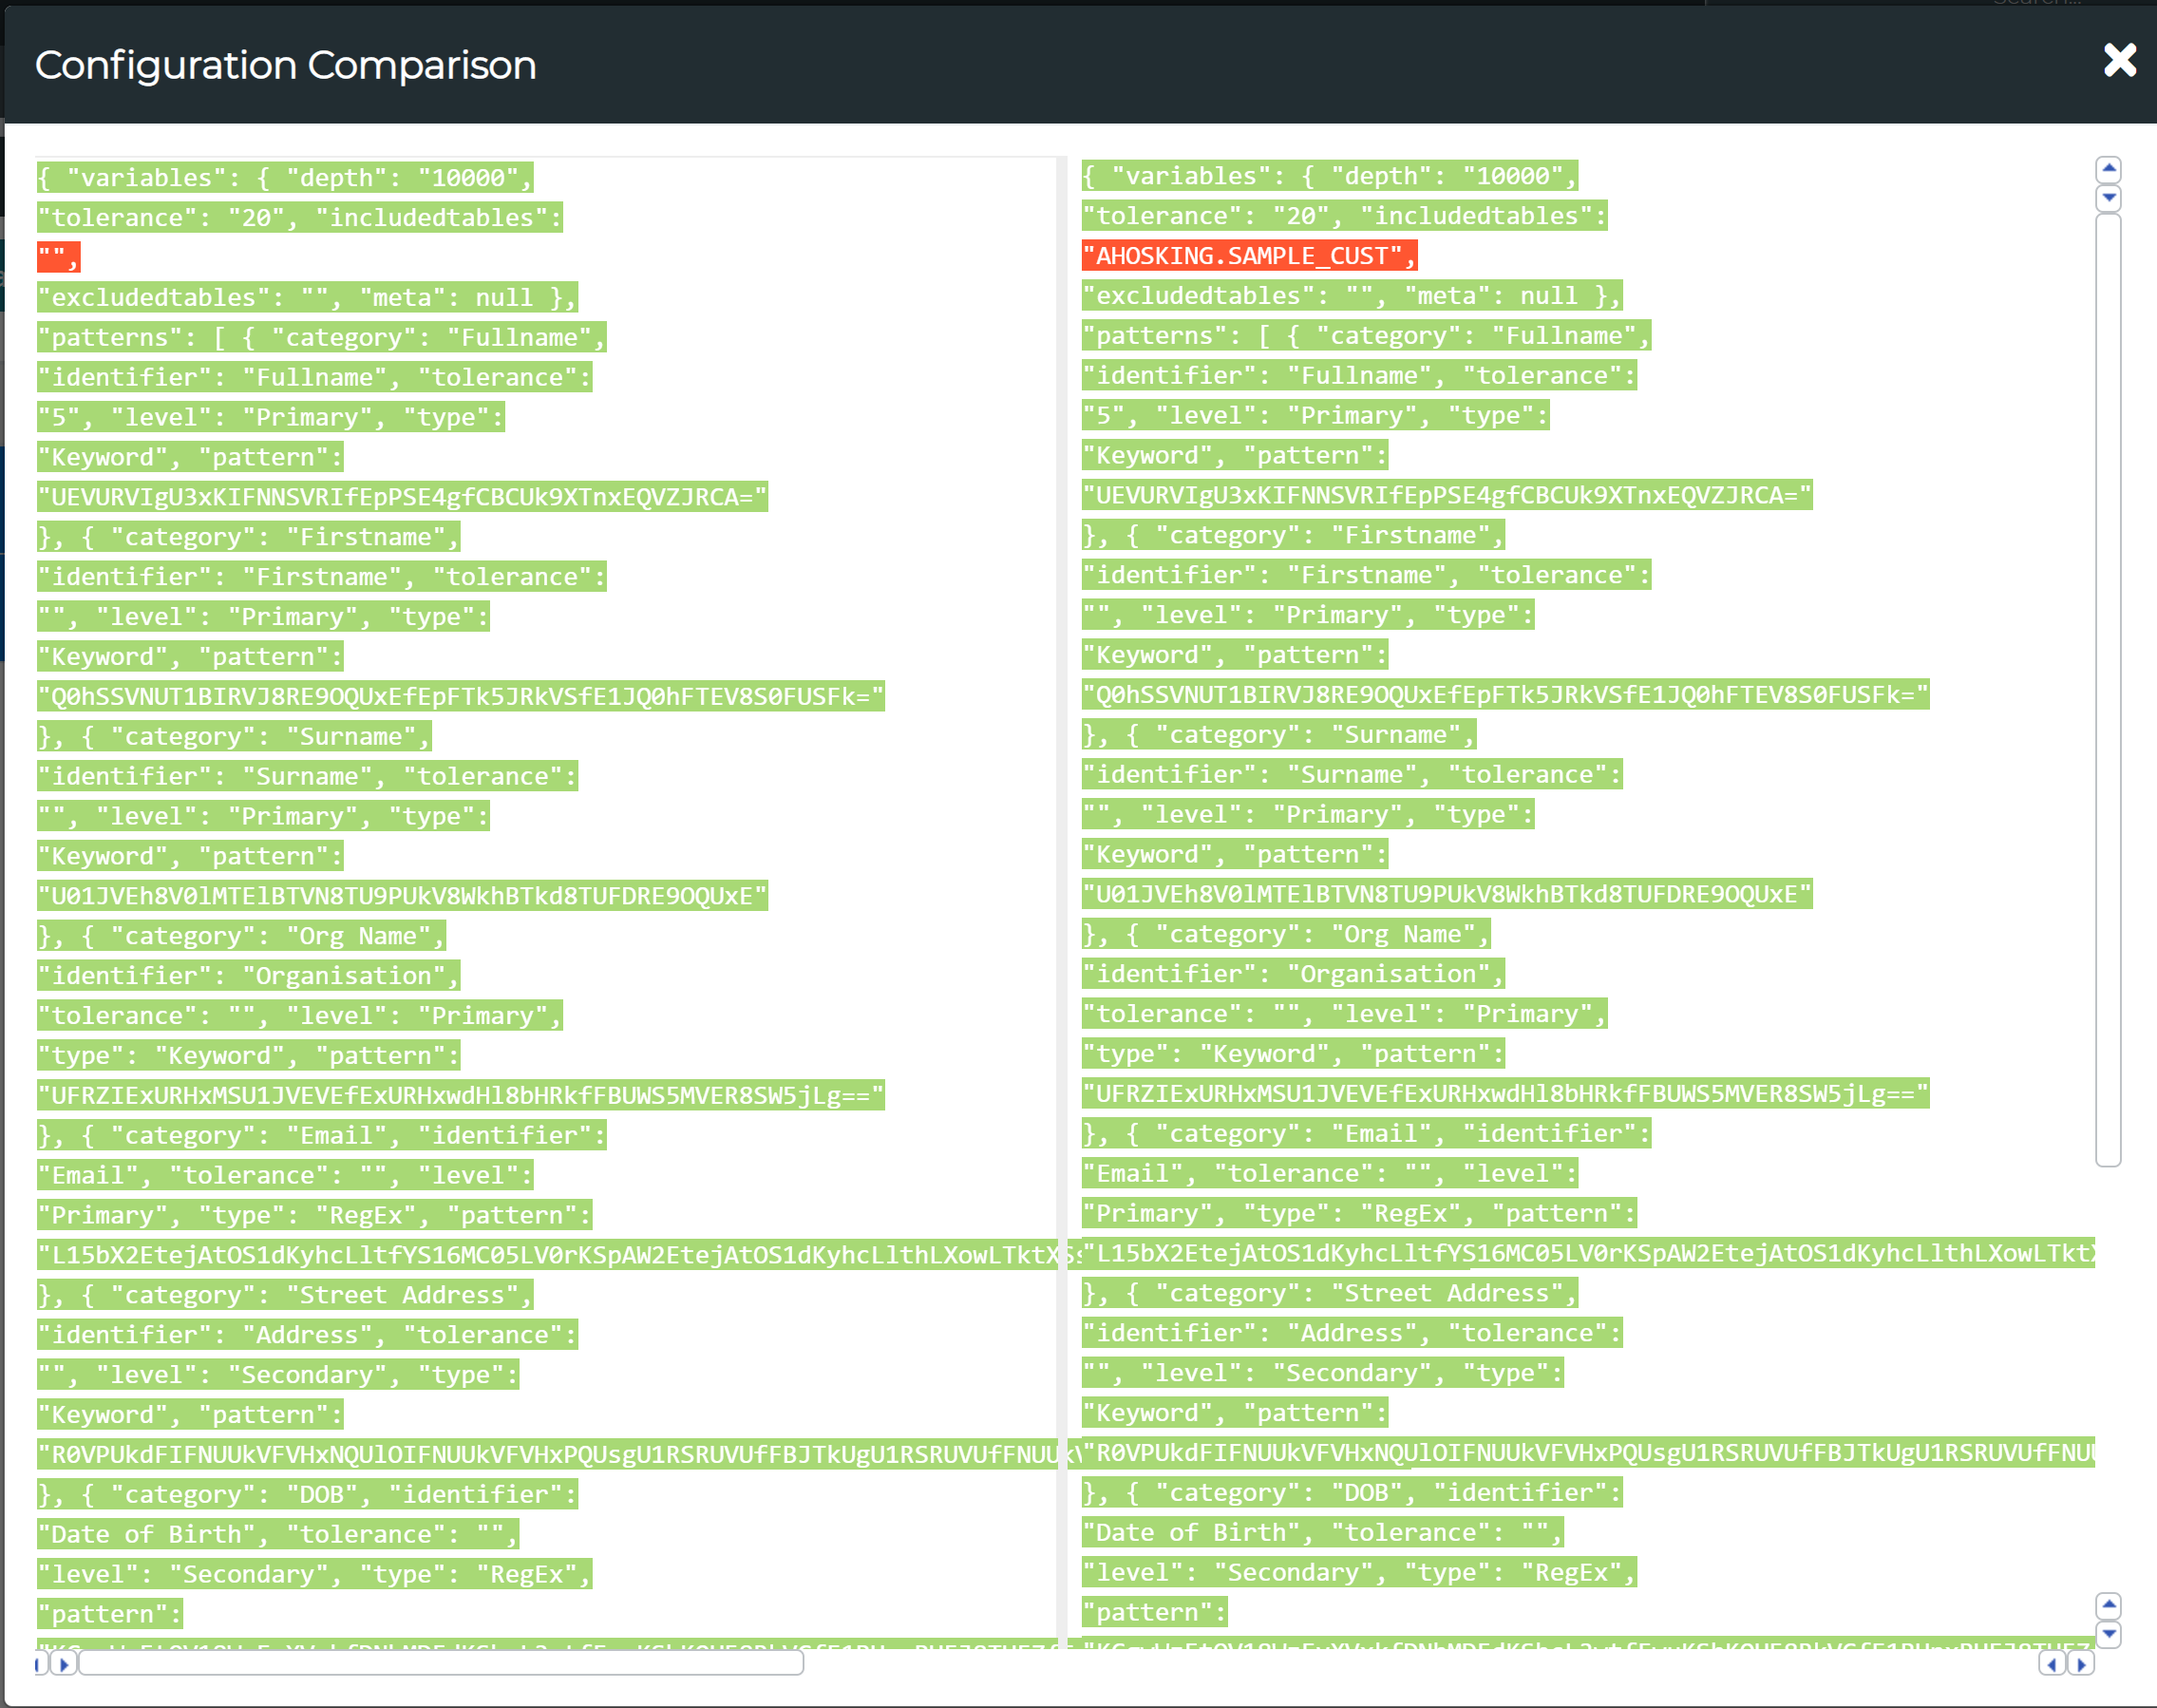
Tick on the check boxes in front of the two configurations which you want to compare and then press the Config Comparison button to view the comparison report. The text highlighted in red marks the differences in the two configurations.
Execute Profiling - Single Data Source
To execute a new profile scan, navigate to Data Management Hub > Execution Console.
Here, you can select your data source then press View.
Full Scan
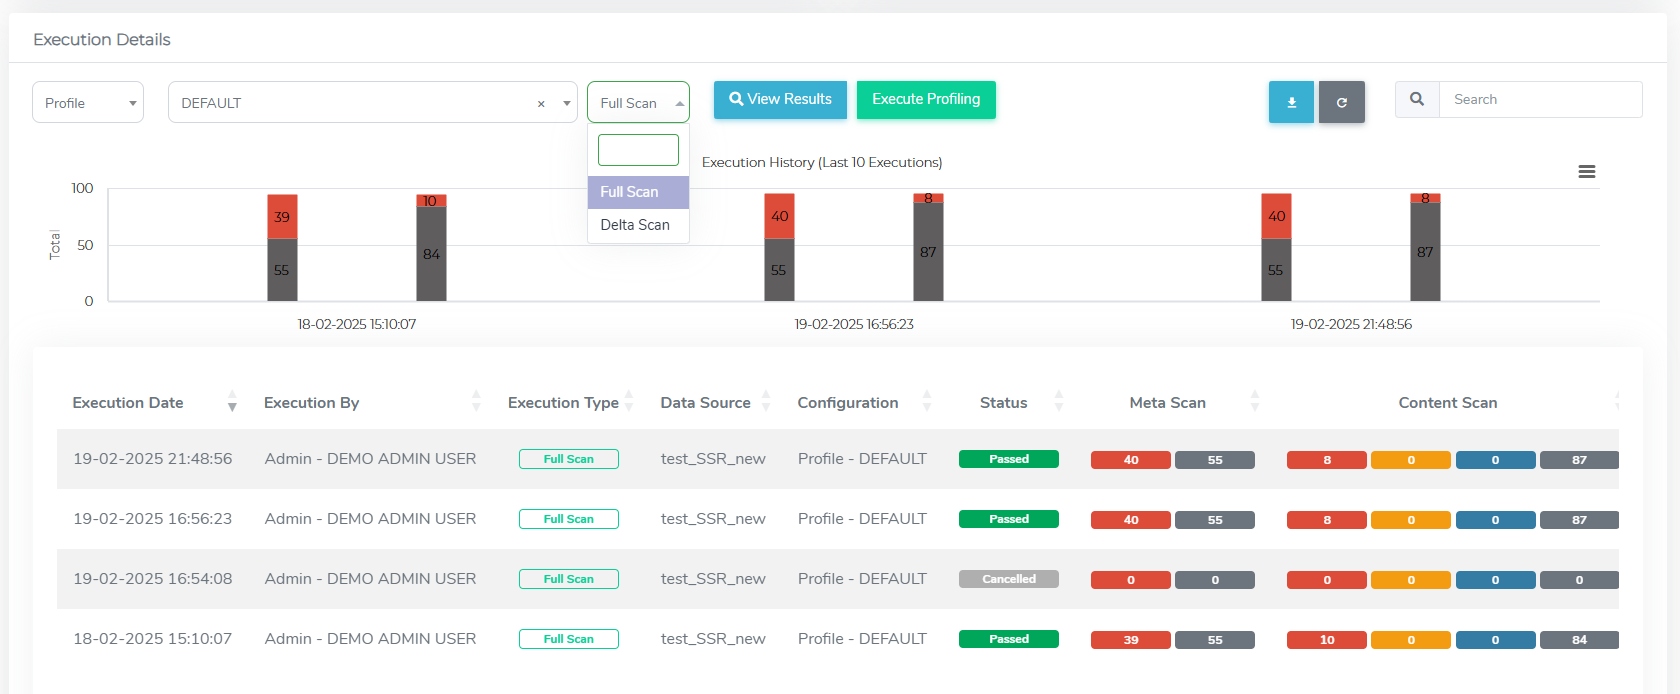
Scroll down to the Execution Details section, select Profile in the first dropdown menu, and your chosen profile configuration in the second dropdown menu. Select Full Scan from the next dropdown menu. The Execute Profiling button can be used to run a profile scan or View Results to simply view the results from the previously ran profile jobs.
Delta Scan
The TDM solution includes Delta Profiling, allowing the system to profile only the changes since the last scan rather than scanning the entire database each time. This significantly reduces profiling time and resource usage for large databases by detecting and processing only new or modified tables and columns.
Scroll down to the Execution Details section, select Profile in the first dropdown menu, and your chosen profile configuration in the second dropdown menu. Select Delta Scan from the next dropdown menu. The Execute Profiling button can be used to run a profile scan or View Results to simply view the results from the previously ran profile jobs.
Note: Some columns may be skipped if they use unsupported data types. See list of unsupported data types here.
Execute Profiling - Connection Groups
In order to run a profile scan on a connection group, firstly ensure TDM Queue Manager is turned on. Then, navigate to Data Management Hub > Execution Console > Connection Group.
Full Scan
Here, select your Connection Group from the first dropdown menu, then select Profile for your scan type, and then the default profile configuration to be used for all or most data sources in the connection group. Ensure Full Scan is selected in the right-most dropdown list, then click View after selecting all fields.

You can further select separate profile configurations from the Data Configuration column for specific Data Sources.

In order to run a bulk profile scan, select all the data sources that you want to execute the scan on and click on Execute.

Then, scroll to the bottom of the page to the Execution Details section to look at the scan status, and access the logs and reports.

Delta Scan
Similar to Full Scan, select your Connection Group from the first dropdown menu, then select Profile for your scan type, and then the default profile configuration to be used for all or most data sources in the connection group. Ensure Delta Scan is selected in the right-most dropdown list, then click View after selecting all fields.

In order to run a bulk profile scan, select all the data sources that you want to execute the scan on and click on Execute.

Then, scroll to the bottom of the page to the Execution Details section to look at the scan status, and access the logs and reports.
Profiling Log
In the Details column, the Log button can be used to view logs for the execution.
Note: The Log window refreshes every 15 seconds if the profile is currently executing.

A currently executing profile scan can also be cancelled by clicking the Cancel button.
Profiling Report - Single Data Source
Successfully completed profiles will generate a Profile Report which can be viewed by clicking the Report button.
This can also be searched on or exported out to Excel or CSV.

Profiling Report Table
| Type | Description |
|---|---|
| Connection Name | The name of the data connection. |
| Schema | The schema under which the table resides. |
| Table Name | The name of the table containing the data. |
| Column | The specific column within the table. |
| Data Type | The type of data stored in the column (e.g., string, integer, date). |
| Data Length | The maximum length of the data in the column. |
| Suggested Content Type | Recommended type of content for the column (e.g., email, address). |
| Row Count | The number of rows present in the table. |
| Execution Status | Profiling status of the mentioned column. |
| Meta | Metadata information related to the column name. |
| Content | Actual content stored in the column. |
| Matching Data | Data that matches the pattern |
| Random Data | Sample random data generated for testing purposes. |
| Error Details | Details of any errors encountered on this column |
Profiling Report - Connection Groups
For grouped connections, each data source in the group will generate a Profile Report if successful, which can be viewed by clicking the Report button.
In order export the reports in bulk, navigate to the Execution Console section in the Connection Group tab, and select the data sources to include in the bulk report.
Click Generate Report, then select the required date range and any additional options. For option details and step-by-step instructions, see Generating Single TDM Report.

Important: Databases and files have different report structures, therefore their reports cannot be generated together in bulk. When selecting the data sources to include in the bulk report, make sure that files and database connections are not selected together.
Creating or Updating a Masking Configuration After a Delta Scan
Once a Delta Scan detects new PII in a data source, you can either add the newly identified PII columns to an existing masking configuration or create a new masking configuration for them.
Single Data Source
In the Execution Details section, locate the execution with Execution Type set to Delta Scan. In the Details column, click + Add.

The Add to Mask Configuration modal appears. From the Action drop-down list, choose Create to create a new masking configuration, or Update to modify an existing one. If you choose Create, enter a new configuration name. If you choose Update, select an existing masking configuration from the drop-down list.

Click the + Save button to apply the changes.

Connection Groups
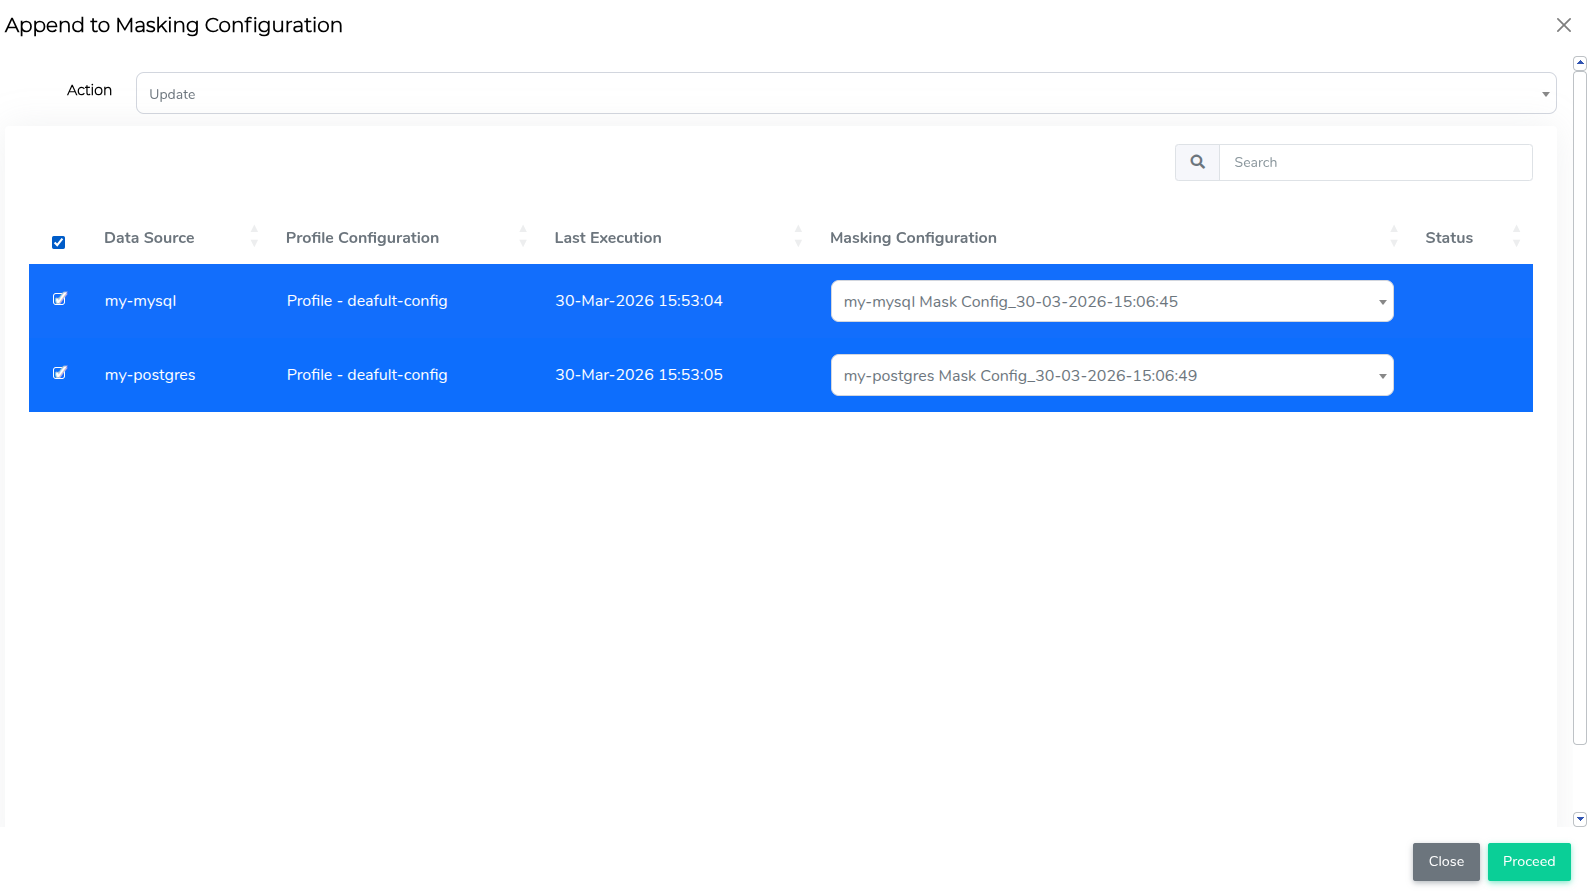
From the Execution Console section, click the + Append to Masking Configuration button.

The Add to Mask Configuration modal appears. From the Action drop-down list, choose Create to create a new masking configuration, or Update to modify an existing one.

If you choose Create, default masking configuration names appear in the Masking Configuration column of the modal, and you can manually enter new names. If you choose Update, select existing masking configurations from the drop-down list in the Masking Configuration column.
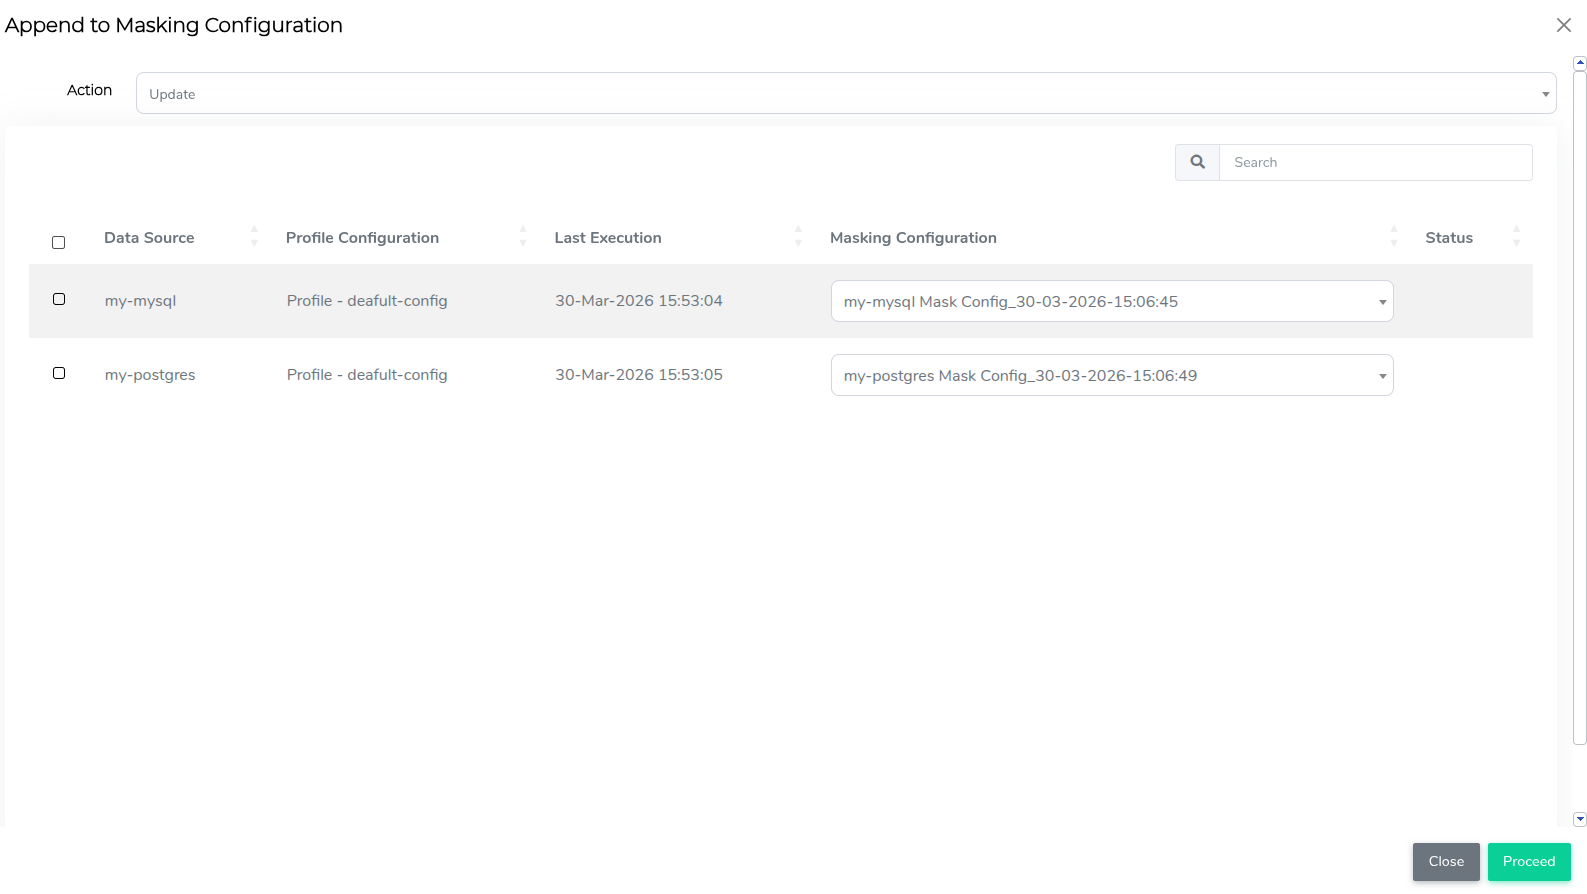
Select the row(s) you want to apply changes, then click the Proceed button.
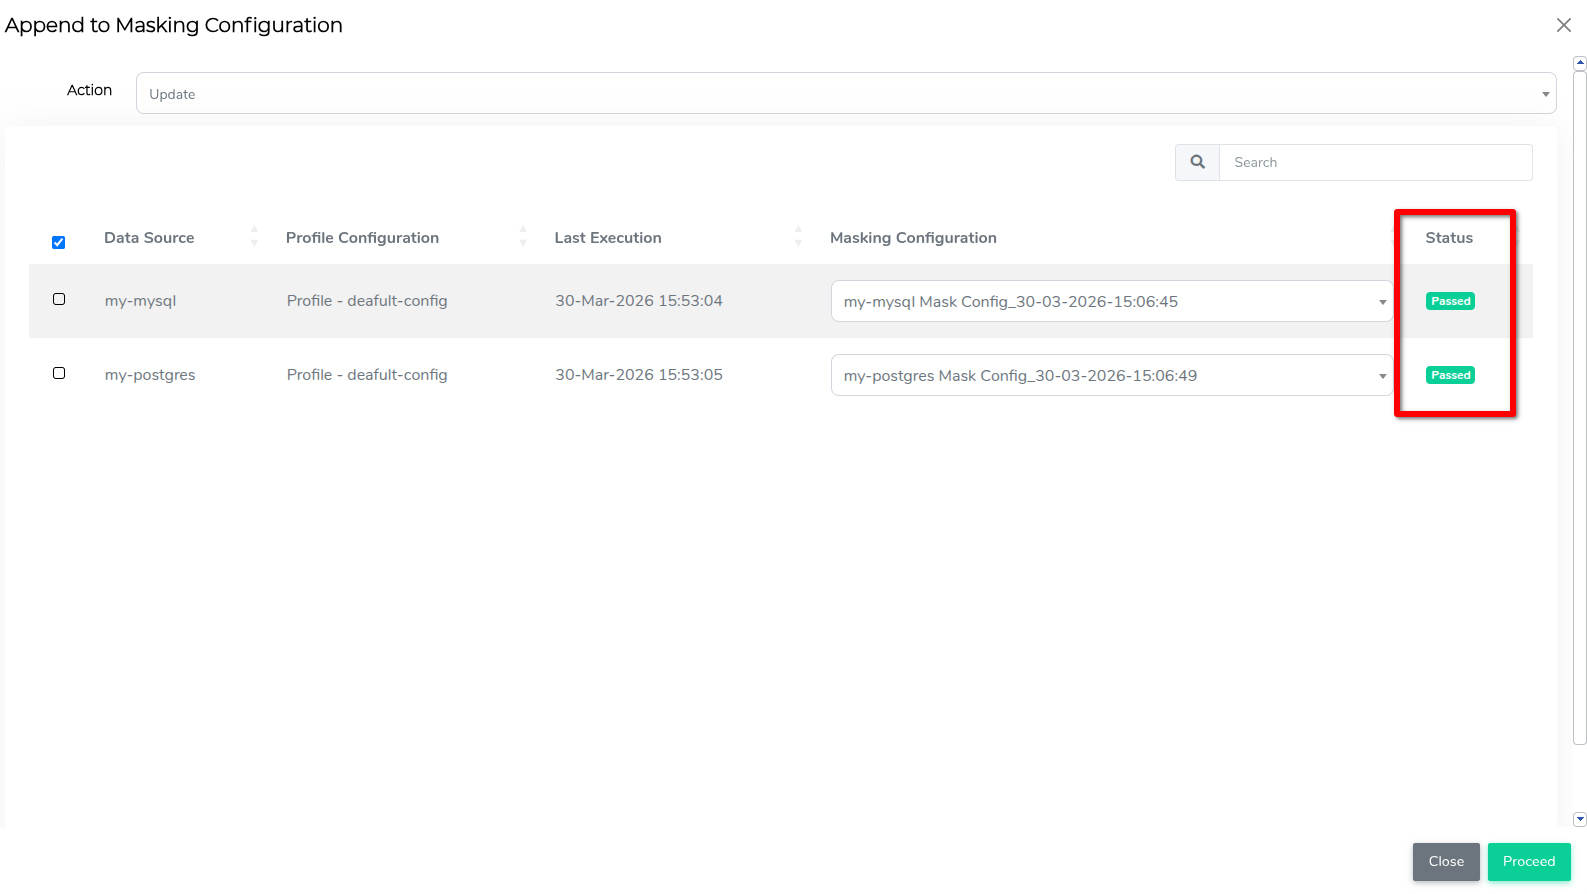
Review the status of each selected row in the modal’s Status column.
Data Type Support Matrix
File-Based Sources
We support a variety of file-based data sources. However, file formats that are embedded within database systems (e.g., XML in Amazon Redshift or JSON in PostgreSQL) are not supported, as these require interpretation by a query engine, not direct file parsing.
| Source | Notes |
|---|---|
| File - Delimited | Schema inferred from headers or predefined formats. |
| File - Fixed Width | Schema inferred using fixed-length field definitions. |
| File - ORC | Columnar format with embedded schema; types parsed dynamically. |
| File - Parquet | Columnar format with embedded schema; profiling handles inferred types. |
| File - AVRO | Self-describing format with embedded schema; handled dynamically. |
| File - XML | Parsed as structured documents; fields handled flexibly. |
| File - JSON | Schema-less format; parsed as key-value pairs or nested structures. |
Database Sources
Database Sources with Supported Data Types (Whitelisted)
| Source | Supported Data Types |
|---|---|
| PostgreSQL | bigint, integer, int8, int4, int2, int, float8, bpchar, text, char, character, varchar,character varying, double precision, date, timestamp without timezone, decimal, numeric, real, smallint, timestamp |
Unsupported Data Type Categories
The following categories of data types are excluded from profiling due to their binary nature, structural complexity, or incompatibility with profiling and masking features.
| Category | Description | Reason |
|---|---|---|
| Binary or Media | Data types such as blob, image, raw, varbinary, binary. | Contain unstructured binary data that cannot be meaningfully interpreted or profiled. |
| Large/Unstructured Text | Data types such as clob, nclob. | Text can be too large, inconsistent, or arbitrary for useful pattern recognition or profiling. |
| Nested or Hierarchical | Data types such as json, jsonb, xml. | Nested and schema-less structures require recursive parsing and dynamic schema inference, out of scope. |
| Geospatial | Data types such as geometry, geography, polygon. | Require domain-specific tooling to interpret and are not compatible with generic profiling logic. |
| System/Internal | Data types such as rowid, cursor, table, pg_lsn. | Typically store metadata or internal references, not actual user or application data. |
Database Sources with Unsupported Data Types (Blacklist)
| Source | Unsupported Data Types | Reason Category |
|---|---|---|
| DB2 | graphic, vargraphic, blob | Binary or Media |
| MySQL | blob, mediumblob, longblob, geometry, bit, bool, boolean, vector, enum, set, binary, varbinary,point, linestring, polygon, multipoint, multilinestring, multipolygon, geometrycollection, json | Binary or Media, Geospatial, Boolean, Complex/Nested, Enumerated |
| MSSQL | image, xml, cursor, hierarchyid, geometry, table, rowversion, uniqueidentifier, geography | Binary or Media, Nested, System/Internal |
| Oracle | blob, bfile, rowid, clob, nclob, raw, long raw | Binary or Media, Large Text, System/Internal |
| Amazon Redshift | xml, json, polygon | Nested, Geospatial |
| Sybase | image, varbinary, binary | Binary or Media |
| Teradata | graphic, vargraphic | Binary or Media |
| MariaDB | blob, mediumblob, longblob | Binary or Media |
Note: While file-based formats like JSON, XML, and others are supported when profiled directly as files (e.g., from a file system or data lake), they are not supported when stored as embedded fields within a database column. This includes data types like
json,jsonb,xml, orclobstoring serialised files.Reason Parsing these formats within database columns is out of scope for standard profiling due to the additional complexity, resource overhead, and processing time required. It's recommended to extract and flatten this data before profiling, or profile it via a supported file-based ingestion method.
Schema-less Database Sources
These sources do not maintain a static list of unsupported types due to their schema-less or flexible structure. Profiling decisions are made dynamically at runtime:
| Source | Handling Approach |
|---|---|
| MongoDB | Schema-less; data is profiled as JSON documents. Binary or unsupported fields are skipped. |
| CouchDB | Similar to MongoDB; JSON-based documents are profiled by field where possible. |